Using Web Analytics to Identify Critical Behaviors in Converting Prospects Into Leads
Web analytics can help marketers see the difference between prospects, leads, and customers when it comes to engagement with a site.
Web analytics can help marketers see the difference between prospects, leads, and customers when it comes to engagement with a site.
Google and CEB helped change the way many website owners think about prospects and leads in 2013 when they published their research showing that amongst 1,500 business people involved in B2B purchases, the buyers did 57 percent of their research before reaching out to communicate with prospective vendors. This research helped demonstrate how it is as important to understand how prospective customers are interacting with our websites before we know who they are as it is to have a Web-informed sales process. But it can be difficult to perform a thorough analysis on prospect behavior on a website simply because we are not sure how to identify these anonymous users.
Web analytics provide amazing insights into how general visitors behave on your website. Out-of-the-box reports are great at showing how visitors choose to navigate across a site, the types of content they consume, and the tools they interact with. With segmentation of visitors that have filled out lead forms, started applications, or started cart transactions, we can start to see the differences between prospects, leads, and customers when it comes to engagement with a site.
However, in creating these important segments it is much easier to analyze lead behaviors and customer behaviors, as these visitors have essentially raised their hand and said “here I am” by taking steps such as filling out forms and making purchases. Prospects, on the other hand, are a little more difficult to identify. Often times when analysts are examining prospect activities such as content preferences, frequency of visits, and number of visitors, the prospect segment is essentially made up of “the others.” The prospect group is typically made up of the users that do not fit into other groups such as career seekers, past leads, current customers, and investors. Creating a segment with such a vague and encompassing definition may decrease the usefulness of any analysis as a large percentage of users within the segment will never convert to a lead regardless of how persuasive your offering or how persuasive your site is simply because that is not what they are there to do. This leaves website owners with a difficult and important question: How do we more effectively analyze the behaviors of prospects?
The first step in tracking prospects is knowing who is not a prospect. It’s important to persistently track website leads and current/past customers when they perform actions such as fill out lead forms, make purchases, or login to customer areas. In Google Analytics we do this with Custom Dimensions and in Adobe Analytics we do this with eVars. Aside from leads and customers, there are a few other segments of visitors that are not likely to ever be viable prospects. I filter out career seekers and investors by their content views. A user that views four pages in the job section of a website and never views a product page is not likely to be a real prospect. I also filter out competitors by their Service Provider names. In Google Analytics it’s great to create a separate View for prospects which completely filters out known leads, customers, career seekers, and competitors.
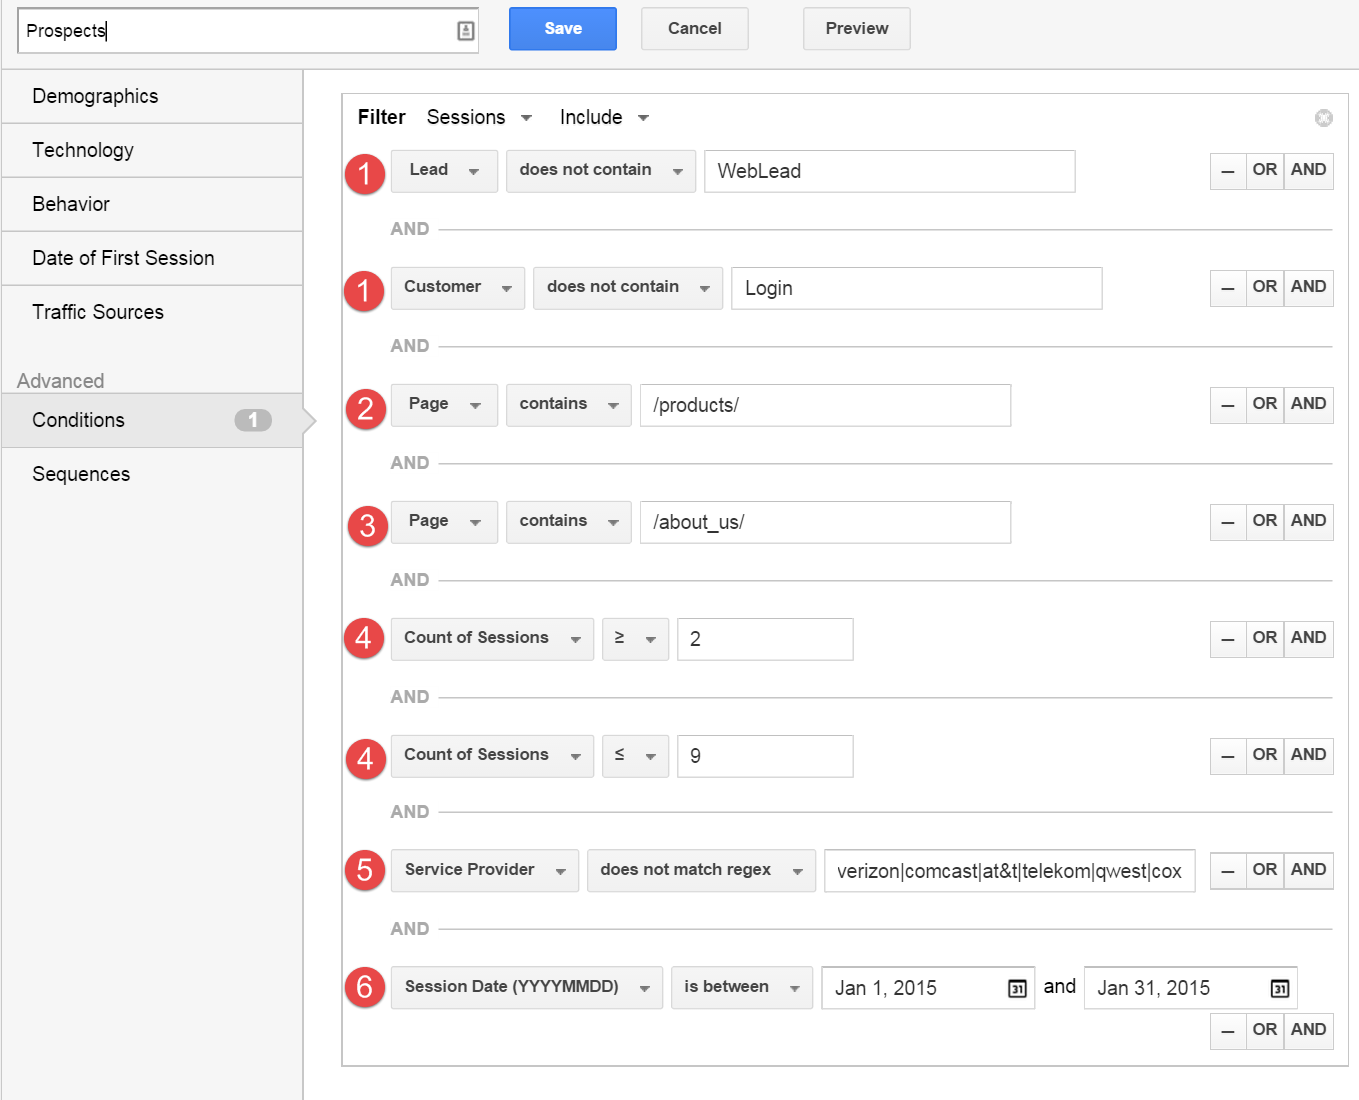
Once the known leads and customers are segmented out, we begin to create behavioral filters for our prospects. Below is an example of a prospect segment I use often.

In this segment, you can see I have created the following filters.
Once our behavioral segment is in place I will look through the Service Provider report to ensure that I can see organizations that I know to be viable prospects. For example, if the company sells construction equipment I will look for construction companies in the Service Provider report or if the company sells software for financial institutions I will look for banks, credit unions, and brokerages. Below is an example Service Provider report of a company that sells data storage systems specifically for large financial institutions.

Once I see multiple good prospects in the Service Provider report I will start to look at the behavioral data to find attributes of the sessions. The following reports provide great data on how these prospects learn about products and research potential vendors.
While it is very difficult to know who is visiting a company website to perform vendor and product research before they are known leads, Web analytics tools are getting better at enabling website owners to understand how this large anonymous segment of users consumes content and utilizes website tools. With all of this information in hand we start to better understand how our prospects research potential vendors before we know who they are. We can start to see which types of behaviors indicate that a prospect is likely to become a qualified lead verses and an abandoned anonymous user. With accurate data on the number of prospects visiting a site we start to understand how much of the site needs to be focused on vendor research and product education verses lead nurturing and sales assistance. While most B2B websites are focused heavily on lead generation, organizations that understand prospective customers need to perform due diligence research before converting to a lead will ultimately be better at educating their prospects and turning them into high-quality customers.