A rookie's guide to Twitter Analytics
Not used Twitter analytics before? Here’s what all of those tools mean.
Not used Twitter analytics before? Here’s what all of those tools mean.
What is Twitter analytics?
Last year, Twitter opened up its analytics dashboard to all users (it was previously only open to advertisers), offering them an insightful glimpse at the data behind their activity.
The service provides users with a central dashboard, from which access can be gained to more detailed information about how well (or badly) they are doing on the platform.
Looking at my own personal Twitter account (which has been abandoned lately), I’m going to highlight how to use the tools Twitter analytics offers, what they mean, how easy they are to use, and how useful they might be to brands.
1) Access Twitter Analytics
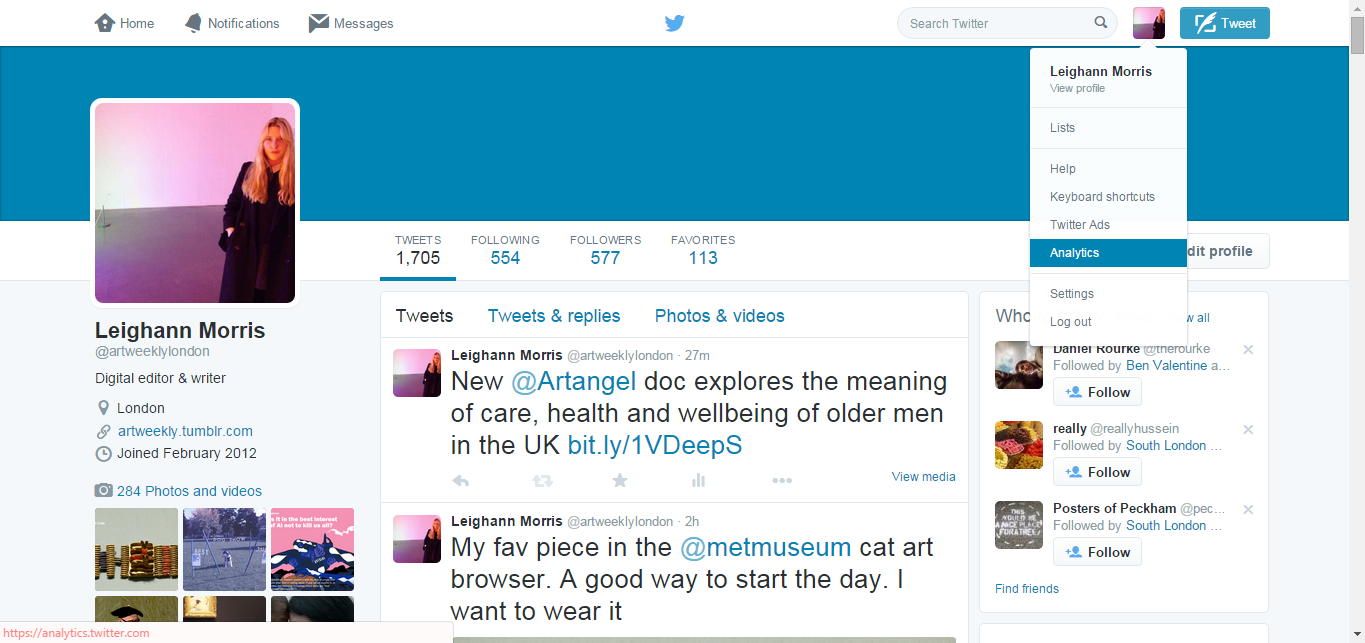
Analytics is available to all users from the drop-down menu on the right hand side of the page.
Once accessed, you’ll reach the Analytics dashboard:
![twitter2]](http://www.clickz.com/wp-content/uploads/2015/10/twitter2.png)
This is an overview of engagement over the past 28 days, compared with the month previous. So:
This is useful as a general overview from which users can speedily pinpoint successes or failures.
Below this, there is a month by month breakdown of which lists variations of top tweets, mentions, and followers, which looks like this:
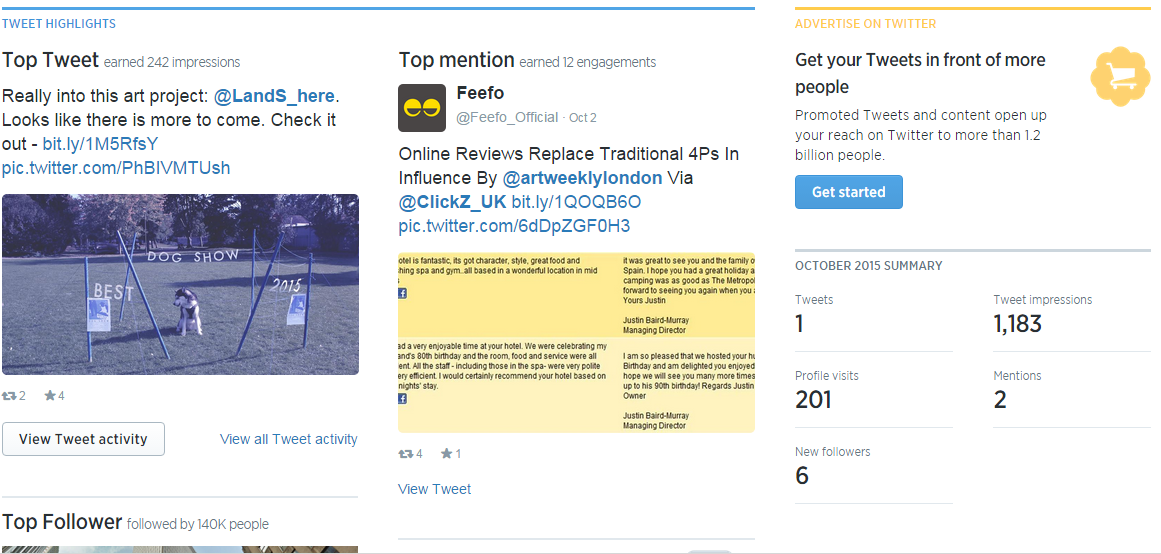
Here, you can identify which tweets were most popular, and the tweet mentioning your handle which received the most engagements – a good way to identify influential people in your network.
2) Tweets
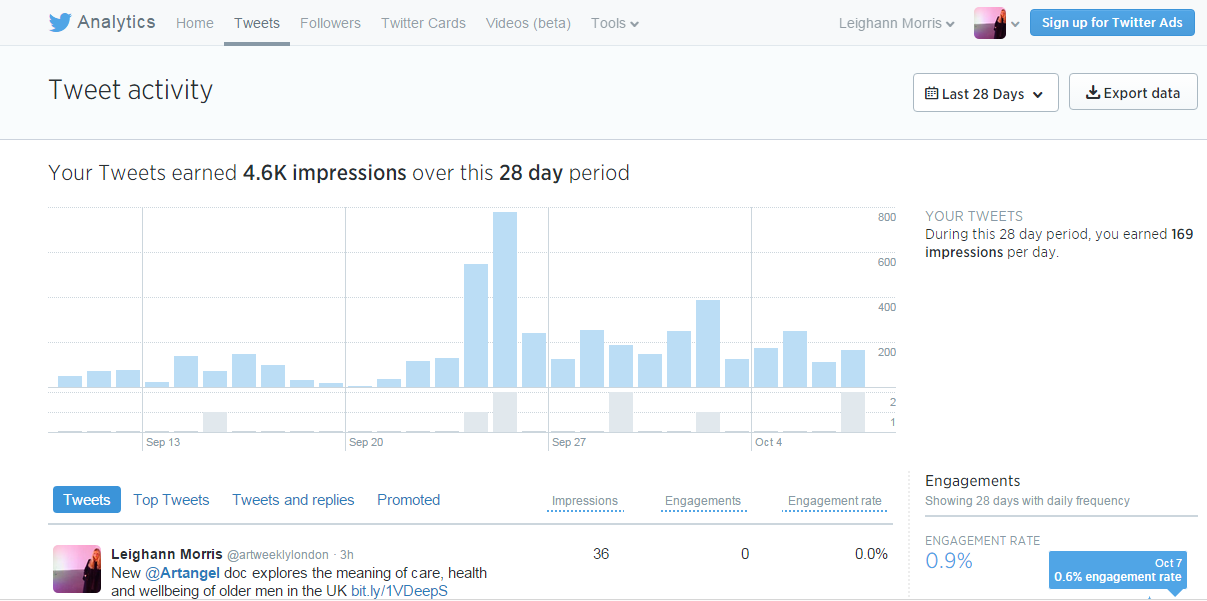
The tweets dashboard is the best place to find detailed information about how your outgoing messages are performing.
The top graph outlines 28 days worth of tweet impressions (selected from the drop down menu on the right – you can change the time period).
The bottom part of the graph (grey) depicts how many times I have tweeted on each day, and the top part of the graph (blue) shows the impressions (times a user is served a tweet in timeline or search results) on each day.
Annoyingly, when you hover over the graph, the tweets don’t appear – but the data is detailed underneath, corresponding to each particular tweet.
My impressions graph shows that:
Under the graph is a section that highlights tweets within the period selected (here, 28 days), and details the impressions (number of times users saw the tweet on Twitter), engagement (total number of times a user has interacted with a tweet, including retweets, replies, clicks, follows, favourites) and engagement rate (number of engagements divided by number of impressions) for each:
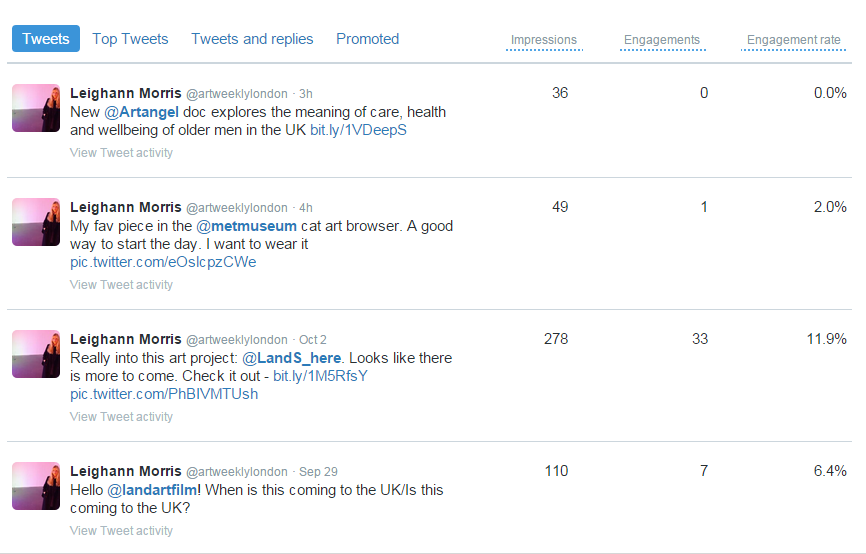
This data can be used to figure out which days showed the best performance, and brands should replicate the tactics used on those particular days to guarantee continued results.
The ‘tweets’ data can also be exported as a useful CLV file, which looks like this:

This more in-depth data can be utilised to discover how interaction has changed, what content your leads interacted with most, and when they interacted with it.
Once downloaded, brands have a clear picture about what is working, and can improve strategy accordingly.
3) Followers
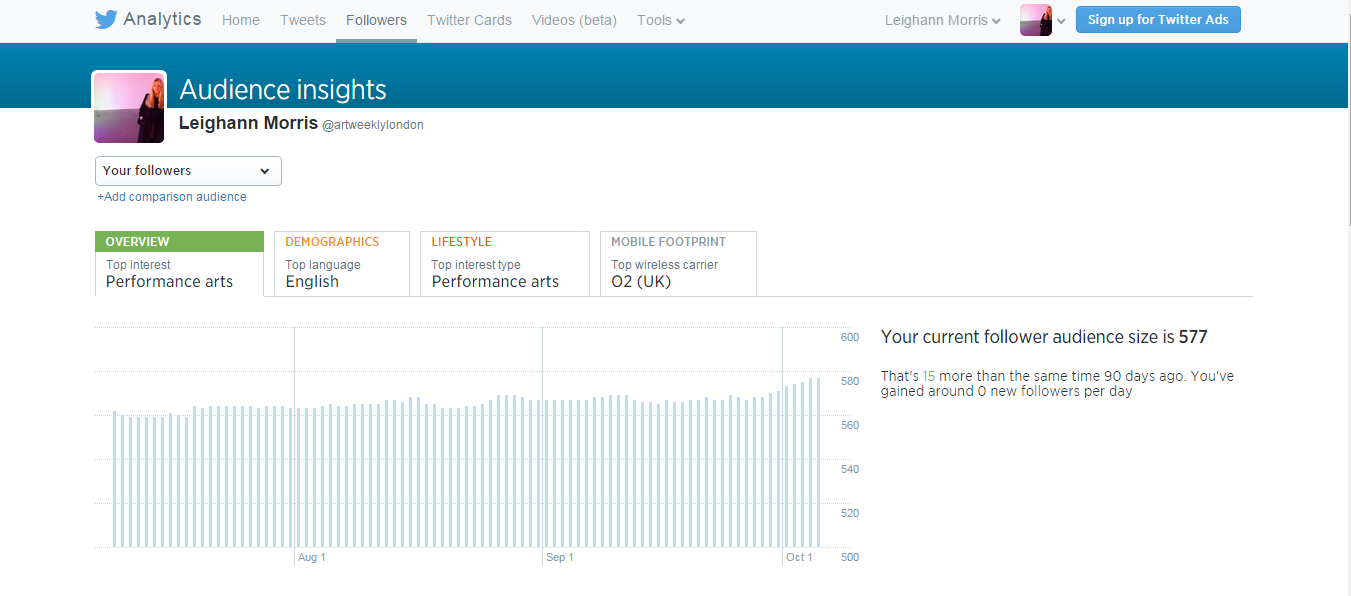
The ‘followers’ component of Twitter Analytics tracks follower increases, information on gender and location, and which topics your followers find most interesting. It’s where you can really get to know who these people are.
By tracking your audience’s changing interests, you are able to optimise your tweets by focusing on specific topic areas.
4) Demographics
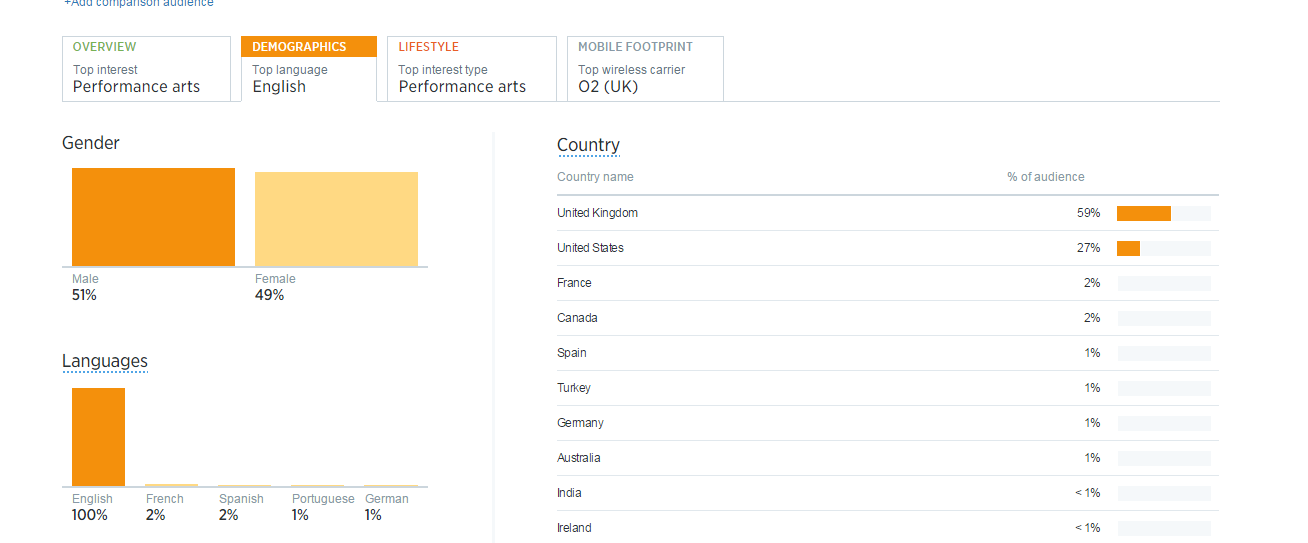
As outlined in the ‘demographics’ section of my followers report, a majority of my followers are from the UK, but a chunk (27%) are from the US – and can’t be forgotten.
Looking at the data as a brand or publisher, it would be useful to schedule tweets according to both US time and UK time, so they reach as many followers as possible.
Why is all of this data useful?
Twitter Analytics provides clear, concise information about when to create content and if your audience actually engages with it, which is invaluable for a brand – not just for traffic but for user experience.
Importantly, although there are numerous guides out there instructing users about the best times to tweet, and what that tweet should comprise of, Twitter Analytics shows us that you should study your own data, pick out what is working, and adapt an engaging strategy from there.
What works for one brand most likely won’t work for yours.


