Six of our favorite data visualization tools
These six data visualization tools can present your bundles of information in an easy and people-friendly format.
These six data visualization tools can present your bundles of information in an easy and people-friendly format.
These six data visualization tools can present your bundles of information in an easy and people-friendly format.
Even the most junior of marketers knows that data is key to revealing powerful insights that can be used to make better business decisions.
But with so much data around, it can all become somewhat confusing. What does it all mean? What points should I be looking at? How can I compare it all?
Well look no further. We’ve compiled a list of six data visualization tools to enable you to simplify your mountains of information and put it into pretty little pictures that make it easy for anybody to understand.
Note: The first three tools do not require any coding skills and can be used by regular people like you and me. The last three are a little more complicated.
Datawrapper is a user-friendly web-based visualization service where you can create basic charts from the information that you provide.
Once you paste your data into the field or upload a comma separated values (CSV) file, the platform will read your document.
Once everything is correct, you can proceed to generate a bar, chart or a table.
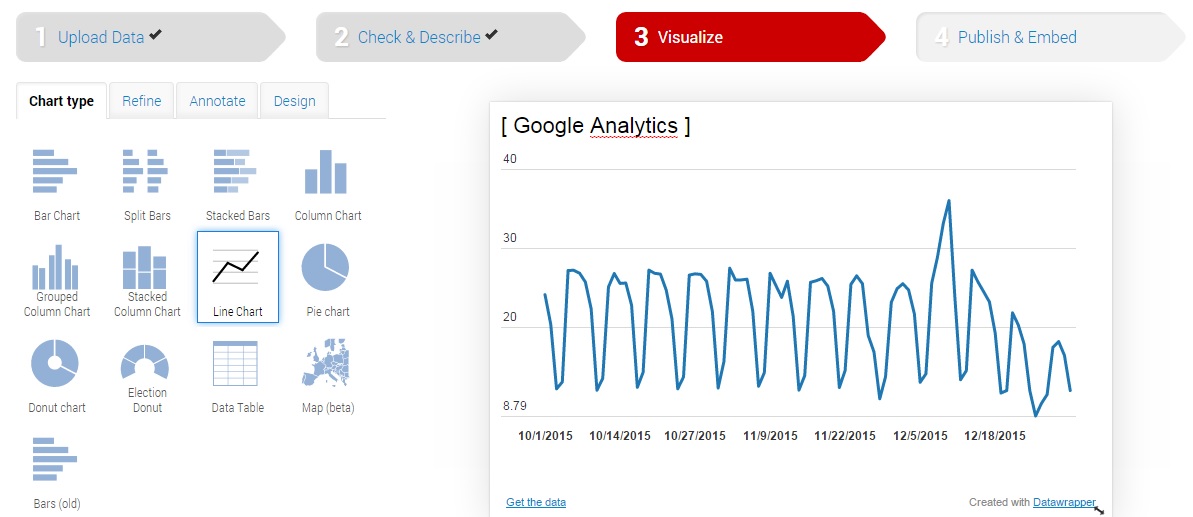
As a free platform, Datawrapper is good for reporters, bloggers and content marketers to embed graphics into their articles.
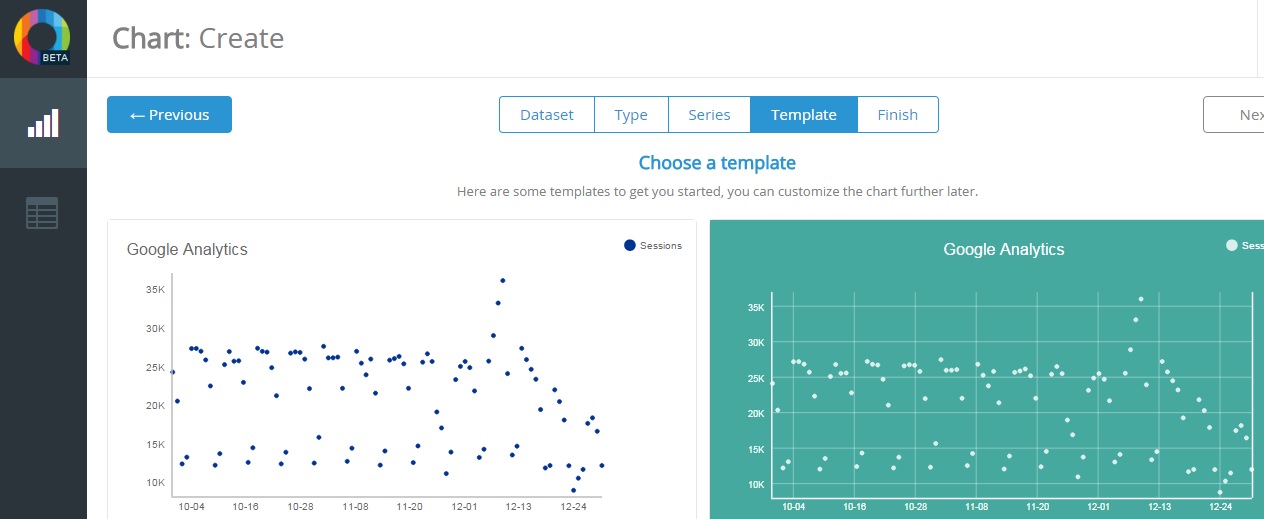
ChartBlocks is another handy free chart builder. Better than Datawrapper, ChartBlocks can read .xlsx spreadsheets in addition to CSV format.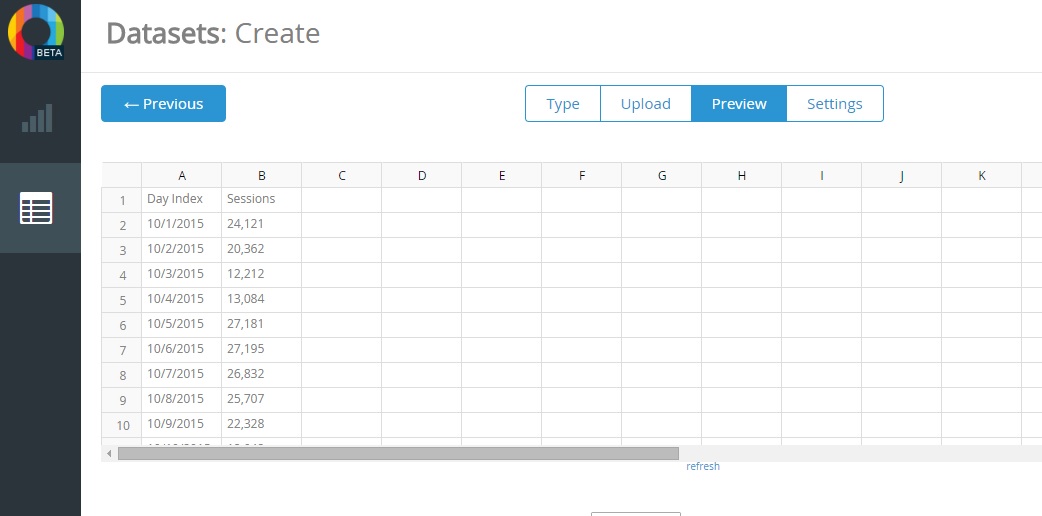
After you have created a chart, you can either export it via scalable vector graphics (SVG) or portable network graphics (PNG) format.
You can then embed it onto your website or share it on social media.
If you want to generate both charts and infographics, Inforgr.am is a great tool to use.
It offers a restricted free service though, with many features unavailable.
For example, I can upload data and make a chart with a free account but I cannot generate an infographic.
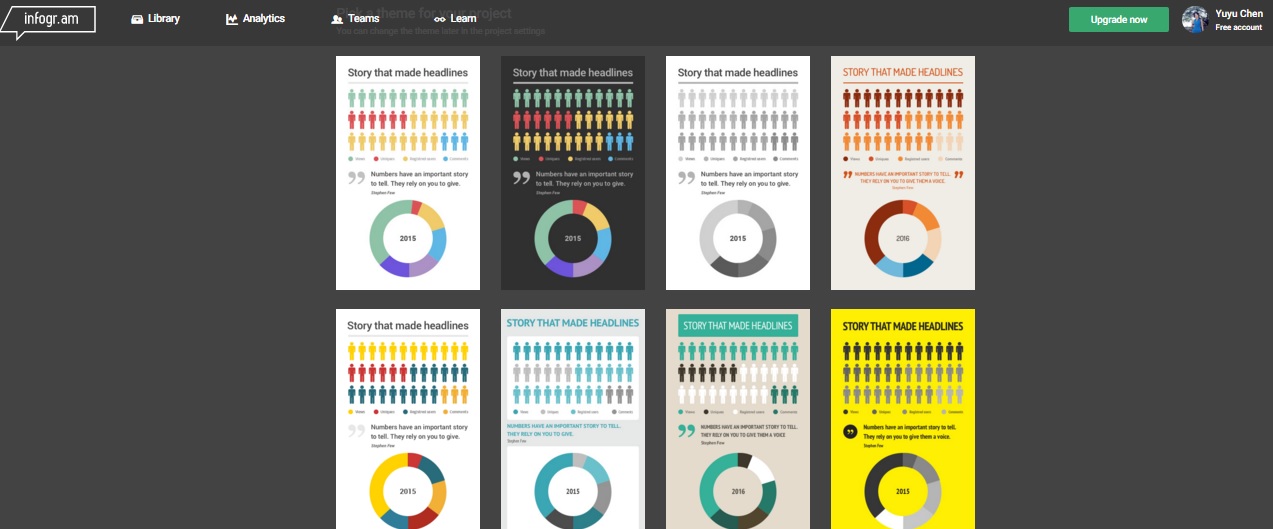
If you want to access Inforgr.am’s wide range of infographic templates, it might be worth paying the $15 a month.
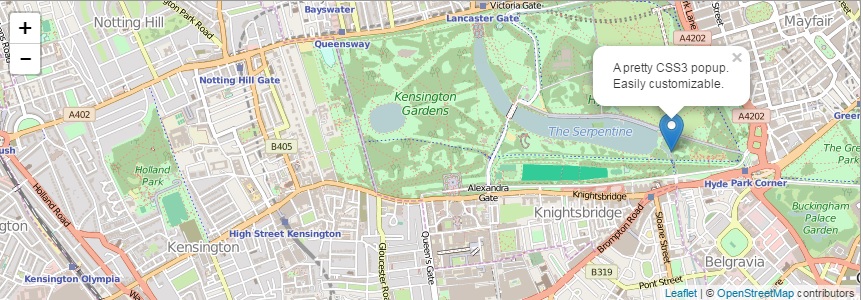
Leaflet is a JavaScript library for interactive apps. It is a handy map builder and uses HTML5 and CSS3 for rendering maps.
It also provides lots of plugins for integrating features like animated markers.
Google Charts is a comprehensive and neat chart builder.
It renders charts in HTML5 or SVG to provide compatibility across browsers and portability across platforms to both iPhones and Android.

It provides many chart types, including bubble, annotation, donut and column.
Chart.js does not offer as many chart types as Google but it renders charts in HTML5 as well.
Developers need to download the service, unzip it and then can write a code for a bar, line or pie based on the below script:
<!DOCTYPE html>
<html lang=”en”>
<head>
<meta charset=”utf-8″ />
<title>Chart.js demo</title>
<script src=’Chart.min.js’></script>
</head>
<body>
</body>
</html>
Hope the above list of tools can help you visualize your data project. Let us know what your favorite one is!


