Analytics Basics: Averages and Ratios
We don't build "average" websites for "average" visitors, so why are we measuring averages?
We don't build "average" websites for "average" visitors, so why are we measuring averages?
When measuring online marketing performance, there are some basics issues that should be considered. Some issues involve the way that the metrics are constructed; in other cases, it involves the way we interpret them.
In part one in this series on analytics basics, I examined two sets of key metrics: tracking unique visitors and tracking new vs. returning visitors.
This time, let’s look at averages and ratios.
Site Activity: Comparing Average, Mean, and Median
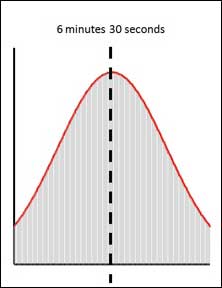
First, let’s look at common metrics used to describe the overall activity levels on a site such “average pages per visit” or “average time on site.” There’s a real problem with the way these metrics are calculated, which makes them virtually useless. Virtually all Web analytics systems use the “mean” when they produce these “average” metrics. The trouble with using the mean is that it works best when the underlying distribution of activity is normally distributed, like in the graphic below. This ties in with our own notion of what an average is in that we general assume that most people will be in and around this number. So if we say that the average time on site is 6 minutes, 30 seconds, we implicitly assume that most people are on the site for around 6 minutes, 30 seconds.
Average Time on Site:
Problem is, most behavior on websites is not normally distributed. If you actually look at how many people stay for how long, or how many people visit how many pages, you will generally find a pattern that looks like the chart below:

Behavior on the web is not “normal.” Most people have relatively small levels of activity and that relatively small numbers of people have higher levels of activity. This “skewed distribution” means that the “mean” is not a very good measure of an average at all. Instead, we need to use the “median“. The median is the point at which 50 percent of the population lies below this value and 50 percent of the population lies above. In my example above, the median is 3 minutes, which gives a very different perspective to the mean of 6 minutes and 30 seconds. It demonstrates that the activity levels are generally not as high as they would first appear.
However, Web analytics systems typically don’t report the median; they report the mean. That’s because it’s easier to calculate the mean in a database than it is to calculate the median. So if you want to report a correct average, you must run the relevant reports and then calculate the median yourself. Another problem is that reporting on “average behavior” is not very useful. These days we generally don’t build “average” websites for “average” visitors. We tend to want to be targeted and so we want to understand the differences in behavior amongst different groups of people rather than understand the average behavior across all people. Averages might be easy to understand but they often don’t tell you anything useful unless you are looking in detail at the behavior of various different segments. So avoid using site-wide averages if you can!
Measuring Conversion Ratios
There’s another group of metrics that must be treated carefully: ratios such as conversion ratio and bounce rate. Ratios can be enormously useful as a metric. However, when they used on a site-wide basis, they can raise more questions than they answer.
There’s nothing wrong about the construct of a number like a conversion ratio, it’s more an issue of interpretation. The problems stems from the fact that a ratio (by definition) is the comparison of two numbers. A conversion ratio is typically the number of transactions or conversion events in a period compared to the number of visits. If the conversion ratio moves, it’s because one or both of these numbers has changed. So immediately you have to investigate the change in both numbers and keep drilling until you understand the root causes.
The conversion ratio is generally used as a measure of overall site performance when it’s also a measure of acquisition performance. And you can’t separate one from the other. Site performance could be improving, for instance, but the conversion ratio could be dropping because the acquisition performance (in terms of the quality of traffic being generated) is deteriorating. What’s needed is a series of “conversion ratios” that track the performance throughout the customer journey from the time someone becomes aware of the site through to the time they ultimately transact. It’s not that a site-wide conversion ratio is a bad metric; it just raises more questions than it answers and is more useful, again, when used at more granular and segmented level.


