30-second summary:
- Facebook’s split-tests appear to maintain a creative history for the control ad. This gives the control a significant advantage with Impressions Per Thousand (IPM) testing.
- Facebook can also group variations with a similar look and feel to the control. So similar-looking ads may also start with a higher IPM.
- Creative concepts that are visually very different from the control do not share a creative history. IPMs for these variations tend to start near zero.
- New, “out of the box” visual concepts may require more impressions for Facebook to quantify their performance.
High-performance creative is a rare thing for social advertising. In our experience, after spending over $3 billion dollars driving UA across Facebook and Google, usually only one out of twenty ads can beat the “best performing control” (the top ad). If a piece of creative doesn’t outperform the best video, you lose money running it. Losers are killed quickly, and winners are scaled to the moon.
The reality is, a vast majority of ads fail. The chart below shows the results of over 17,100 different ads. Spend is distributed based on ad performance. As you can see, out of those 17,000 ads, only a handful drove a majority of the spend.

The high failure rate of most creative shapes creative strategy, budgets and ad testing methodology. If you can’t test ads quickly and affordably, your campaign’s financial performance is likely to suffer from a lot of non-converting spend.
But testing alone isn’t enough. You also must generate enough original creative concepts to fuel testing and uncover winners. Over the years, we’ve found that 19 out of 20 ads fail (5% success rate), you don’t just need one new creative: You need 20 new original ideas or more to sustain performance and scale!
And you need all that new creative fast because creative fatigues quickly. You may need 20 new creative concepts every month, or possibly even every week depending on your ad spend and how your title monetizes (IAA or IAP). The more spend you run through your account, the more likely it is that your ad’s performance will decline.
So, we test a lot of creative. In fact, we produce and test more than 100,000 videos and images yearly for our clients! But we don’t just test a lot of new creative ideas. We also optimize our creative testing methodology. That might sound a little “meta,” but it’s essential for us to be validate and challenge our approach and results.
When we choose a winning ad out of a pack of competing ads, we’d like to know that we’ve made the right decision. When we kill four out of five new concepts because they didn’t test well, we react by moving on and pivoting the creative strategy based on results to try and find other ideas that may perform.
Because the outcomes of our tests have consequences – sometimes big consequences – we test our testing process. We question our testing methodology and the assumptions that shape it.
How we’ve been testing creative until now
For the past few years, in an effort to streamline our Facebook and Google creative testing and reduce non-converting spend, we’ve been testing new video concepts using IPM (Impressions Per Install) as the primary metric.
For the record, using IPM is not the Facebook recommended best practice to allow ad sets to get out of the learning phase by gathering enough data to become statistically valid.
When testing creative we typically would test three to five videos along with a control video using Facebook’s split test feature.
We would show these ads to broad or 5-10% LALs (Lookalike) audiences, and restrict distribution to the Facebook newsfeed only, Android only and we’d use mobile app install bidding (MAI) to get about 100-250 installs.
If one of those new “contender” ads beat the control video’s IPM or came within 10%-15% of its performance, we would launch those potential new winning videos into the ad sets with the control video and let them fight it out to generate ROAS.
We’ve seen hints of what we’re about to describe across numerous ad accounts and have confirmed with other advertisers that they have seen the same thing. But for purposes of explanation, let’s focus on one client of ours and how their ads performed in recent creative tests.
In the two months, we produced +60 new video concepts for this client. All of them failed to beat the control video’s IPM. This struck us as odd, and it was statistically impossible.
We expected to generate a new winner 5% of time or 1 out of 20 videos – so 3 winners. Since we felt confident in our creative ideas, we decided to look deeper into our testing methods.
Traditional testing methodology includes the idea of testing a testing system or an A/A test. A/A tests are like A/B tests, but instead of testing multiple creatives, you test the same creative in each “slot” of the test.
If your testing system/platform is working as expected, all “variations”, should produce similar results assuming you get close to statistical significance.
If your A/A test results are very different, and the testing platform/methodology concludes that one variation or another significantly outperforms or underperforms compared to the other variations, there could be an issue with the testing method or quantity of data gathered.
Here’s how we set up an A/A test to validate our non-standard approach to Facebook testing.
The purpose of this test was to understand if Facebook maintains a creative history for the control and thus gives the control a performance boost making it very difficult to beat – if you don’t allow it to exit the learning phase and reach statistical relevance.
- We copied the control video four times and added one black pixel in different locations in each of the new “variations.” This allowed us to run what would look like the same video to humans but would be different videos in the eyes of the testing platform. The goal was to get Facebook to assign new hash IDs for each cloned video and then test them all together and observe their IPMs.
- These are the ads we ran… except we didn’t run the hotdog dog; I’ve replaced the actual ads with cute doges to avoid disclosing the advertiser’s identity. IPMs for each ad in the far right of the image.
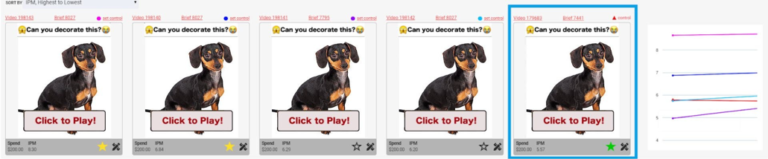
Things to note here:
- The far-right ad (in the blue square) is the control.
- All the other ads are clones of the control with one black pixel added.
- The far-left ad/clone outperformed the control by 149%. As described earlier, a difference like that shouldn’t happen. If the platform was truly variation agnostic, BUT – to save money, we did not follow best practices to allow the ad set(s) to exit the learning phase.
We ran this test for only 100 installs. Which is our standard operating procedure for creative testing.
Once we completed our first test to 100 installs, we paused the campaign to analyze the results. Then we turned the campaign back on to scale up to 500 installs in an effort to get closer to statistical significance.
We wanted to see if more data would result in IPM normalization (in other words, if the test results would settle back down to more even performance across the variations).
However, the results of the second test remained the same. Note: the ad set(s) did not exit the learning phase and we did not follow Facebook’s best practice.
The results of this first test, while not statistically significant, were surprisingly enough to merit additional tests. So we tested on!
Second A/A test of video creative
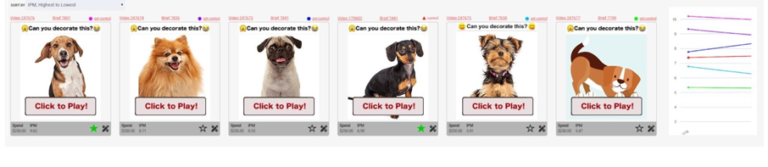
For our second test we ran the six videos shown below. Four of them were controls with different headers; two of them were new concepts that were very similar to the control. Again, we didn’t run the hotdog dogs; they’ve been inserted to protect the advertiser’s identity and to offer you cuteness!
The IPMs for all ads ranged between 7-11 – even the new ads that did not share a thumbnail with the control. IPMs for each ad in the far right of the image.

Third A/A test of video creative
Next, we tested six videos: one control and five visually similar variations to the control but one very different to a human. IPMs ranged between 5-10. IPMs for each ad in the far right of the image.
Fourth A/A test of video creative
This was when we had our “ah ha!” moment. We tested six very different video concepts: the one control and five brand new ideas, all of which were visually very different from the control and did not share the same thumbnail.
The control’s IPM was consistent in the 8-9 range, but the IPMs for the new visual concepts ranged between 0-2. IPMs for each ad in the far right of the image.

Here are our impressions from the above tests:
- Facebook’s split-tests maintains creative history for the control video. This gives the control a advantage with our non-statistically relevant, non-standard best practice of IPM testing.
- We are unclear if Facebook can group variations with a similar look and feel to the control. If it can, similar-looking ads could also start with a higher IPM based on influence from the control — or perhaps similar thumbnails influence non-statistically relevant IPM.
- Creative concepts that are visually very different from the control appear to not share a creative history. IPMs for these variations are independent of the control.
- It appears that new, “out of the box” visual concepts vs the control may require more impressions to quantify their performance.
- Our IPM testing methodology appears to be valid, if we do NOT use a control video as the benchmark for winning.
IMP testing summary
Here are the line graphs from the second, third, and fourth tests.

And here’s what we think they mean:
Creative testing 2.0 recommendations:
Given the above results, those of us testing using IPM have an opportunity to re-test IPM winners that exclude the control video to determine if we’ve been killing potential winners. As such, we recommend the following three phase testing plan.
Creative testing phase 1: Initial IPM test
- Use 3~6 creatives in one ad set with MAI bidding (NEVER include control in the ad set)
- Less expensive than Facebook split testing but not a best practice and will not achieve statistically relevance
- 5% LAL in US (for other countries, still use 5% LAL)
- This will give you a audience reach of 10M or smaller (other geos)
- Isolate one OS (iOS or Android)
- Facebook Newsfeed only
- Generate over 100 installs (50 installs are acceptable in high CPI scenarios)
- 100 installs: 70% confidence with 5% margin of error
- 160 installs: 80% confidence with 5% margin of error
- 270 installs: 90% confidence with 5% margin of error
- Lifetime budget: $500~$1,000 to drive installs that reaches more than 70% confidence level
- Goal is to kill IPM losers quickly and inexpensively and then take top 1~2 IPM winners to phase 2
Creative testing phase 2: Initial ROAS test
- Once you have high IPM winners identified, you can move into initial ROAS testing to see if high IPMs also will generate revenue
- Create a new campaign
- Test IPM winners from Phase 1 with AEO or VO
- 10% LAL, auto placement, Android or iOS but do NOT test using WW audiences, chose only one country
- 1 ad set with IPM winners from phase 1
- Create new campaigns for new IPM winners from next rounds – do not add winners from other tests
- Lifetime budget: $800~$1,500
Creative testing phase 3: ROAS scale test
- Choose winners from Phase 2 with good ROAS
- Use CBO, create new ad set and roll them out towards the target audiences that produce good results for the control
- New ad set for new creative winners from different testing rounds
- Never compete against control in an ad set, instead, have them separated and compete for more budget within the same campaign
We’re still testing many of our assumptions and non-standard practices
- Is it helpful to warm up IPM winners and establish “creative history” by purchasing installs in inexpensive countries?
- How long should IPM winners be “isolated” from the control to allow time for learning to be built up?
- 5-10% of LAL is contingent on the population of the country being tested?
- Results don’t appear to change being run as 1 ad per ad set or many ads per ad set?
- Will lifetime vs daily budgets matter?
- Does a new campaign matter?
- Does resetting the post ID matter?
- Should creative testing be isolated to a test account?
We look forward to hearing how you’re testing and to sharing more of what we uncover soon.
Brian Bowman is the founder and CEO of ConsumerAcquisition. He is an elite mobile performance marketer with expertise in user acquisition, general management and product strategy. His experience spans start-up and large company environments with a track record of navigating online businesses to profitability and high-growth. Brian has profitably managed over $1B in online advertising spend and product development for leading online brands including Disney, ABC, Match.com and Yahoo!.