That’s all changed. Today, you have far more efficient methods of understanding customer behavior available to you as a marketer. By collecting behavioral data for every visitor on your website, you can begin to understand where they are struggling, and use data-driven insights to improve the user experience.
This content was produced in collaboration with SessionCam.
A couple of weeks ago we reviewed four key data collection methods for behavioral data, including:
- Website analytics tools such as Google Analytics: These are useful for providing a top-level overview of your website’s pages, including which drive the most traffic, which keep users engaged for the longest, and which generate the most revenue.
- Heatmap tools: These allow you to take a more in-depth look at interactions across individual areas of your site – such as a checkout page – to see where visitors are hovering, scrolling and clicking most frequently.
- Session replay gives you the ability to be a ‘fly on the wall’ of an individual visitor’s session, seeing how they interact with the site, which pages they engage with, and where they click.
- Clickstream data goes even further, showing you where your website visitors were before they came to your site and where they go afterwards. This puts the journey into context, providing an insight into where your website fits into a browsing session.
So, how can you use this raw data to identify UX issues? Here are some quick tips:
How to use website analytics
404s: Seeing which pages redirect to your 404 page is easy. Fixing broken links significantly improves the user experience.
High exit rate: Pages with an above-average exit rate are quick to identify and are a definite UX red flag, often signalling that visitors are encountering irresolvable issues.
High bounce rate/low conversion: Another quick win from your website analytics – a high bounce rate tells you that users are deciding that the page is not what they’re looking for and immediately navigating away.
Page refreshes. This metric applies most obviously to a checkout page. Multiple page refreshes are usually caused by one of two things — either a user is manually refreshing the page after encountering an issue or the refresh is triggered automatically after an error (such as a field not being filled in).

How to use heatmap data
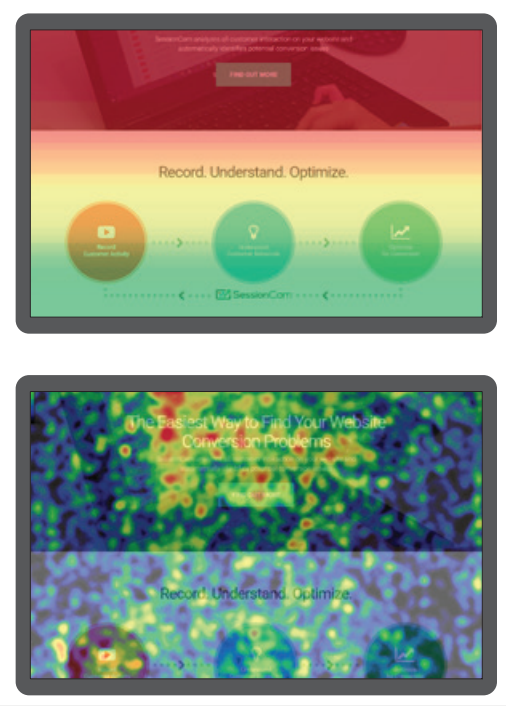
Click recurrence: Red areas – where visitors are clicking frequently – is an indicator of intent, showing where visitors are trying to interact with your website. Typical hotspots will be around the navigation bar and calls to action.
However, if an area shows up red but doesn’t contribute to the page’s goal (e.g. signing up, requesting information, completing a purchase) it is likely to be distracting users from completing the desired action. On the flipside, blue areas can reveal where there’s great content on the page that visitors aren’t interacting with.
Heatmaps can also highlight when visitors think they can interact with an element that isn’t clickable. For example, when a category page contains a list of products with images – visitors might assume that clicking the images will take them to the product page. If you’ve only set up the hyperlink on the product name, this will frustrate users.
How to use Session Replay
Feel like you have all the data at your fingertips and still can’t work out what the issue is? Session replay shows you exactly what’s happening from a first-person perspective – providing valuable qualitative data.
But be aware of confirmation bias when reviewing sessions. This bias is inherent in everyone, meaning you tend to focus on evidence that confirms your latent assumptions and ignore facts that don’t fit.
To counteract confirmation bias try to implement an objective and repeatable process. Create a framework which operationalizes things like friction, distraction and engagement, so you can compare sessions against each other.
Having one person dedicated to reviewing sessions minimizes the scope for subjective interpretation and increases the validity of session comparisons.
One of the other issues with Session Replay is navigating the sheer number of sessions. Luckily, some of the more sophisticated platforms use machine learning to prioritize the most valuable sessions for you.

How to use clickstream data
Clickstream tools can capture everything from search engine queries and domain visits to conversions and purchases. That’s a lot of data to contend with, so it’s essential you understand what you’re testing for before you start. For example, results can be segmented according to different creatives, customer types, demographics or geographies.
When analyzing the results, you should compare them with a control group to identify the best-performing variants and opportunities for optimization.

For more expert advice on optimizing your website for conversions, register for our next webinar with SessionCam: How to Convert Your Website Visitors into Customers.
Content produced in association with SessionCam. Click here to read our collaborative content guidelines. Views and opinions expressed in this article do not necessarily reflect those of ClickZ.