Internet Activity Index Identifies Cyclical Usage
June's Internet Activity Index tracks consistency and seasonality in online usage.
June's Internet Activity Index tracks consistency and seasonality in online usage.
Internet activity patterns are cyclical, according to the Online Publishers Association‘s (OPA’s) Internet Activity Index for June 2005.
 |
| Click on graphic to view Share of Time Chart |
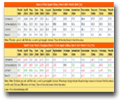
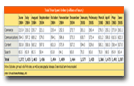
Findings in the report point to a consistency and seasonality in consumer behavior. Time spent on content increased 2.5 percent month over month in June to 36.9 percent. Communications gained 0.7 percent for the same period. Search experienced a month-over-month dip of 8.5 percent for June, and commerce went down 4.9 percent.
Content may be king with time spent online, but search’s drop off doesn’t mean advertisers have to pull from the search space, says Michael Zimbalist, president of the OPA. “Search is bought differently; it measures time, so you can’t correlate the spending patterns.”
 |
| Click on graphic to view Total Time Spent Online Chart |
Cyclical trends are evident. Content rose from 36.0 percent in May 2005 to 36.9 percent in June. The increase is likely due to vacation planning. The content sites with the highest increase rate are travel- and weather-related sites. Online music also generates a chunk of time spent, as do high-profile news and sports events, such as the revelation of Deep Throat’s identity and the US Open golf tournament.
The increase in communications, including IM activity, is attributed to students being home from school.
Commerce’s decline is seasonal. Commerce experienced the largest year-over-year gains in share of time spent online, up 1.8 percentage points from 15.7 percent in June 2004 to 17.5 percent in June 2005.
|
| Click on graphic to view Percentage of Reach Chart |
“Commerce has been on a steady growth, not a huge growth,” said Corey Jeffrey, senior analyst at Nielsen//NetRatings. “It goes down in January, but not as far as before. It’s the step function year-over-year.”
The Internet Activity Index uses data compiled by Nielsen//NetRatings’ NetVew service. The NetView panel consists of 28,000 individuals and tracks Web use at work and home.


