Seven of the biggest industry stats of 2015
Here's a roundup of important industry stats in 2015, ranging from ad spend to video to social media marketing.
Here's a roundup of important industry stats in 2015, ranging from ad spend to video to social media marketing.
This year brought plenty of opportunities for marketers, as evidenced in increasing digital ad budgets. Here’s a round-up of important industry stats in 2015, ranging from ad spend to video to social media marketing.
Some of these stats (the records set by Alibaba and digital advertisers in the U.S.) pertain to 2015, while others (the upcoming explosion in connected devices) are more future stats predicted in 2015. Either way, these seven figures will help you keep up with the latest industry trends and developments.
U.S. Internet ad revenue reached $15 billion in Q3 of 2015, making it the highest quarter on record, according to the Interactive Advertising Bureau (IAB). This figure marks a 23 percent increase compared to Q3 2014 and its then record-breaking total of $12.2 billion.
It also represents a 5 percent increase from Q2 2015, which came in at $14.3 billion.

WPP’s media buying arm GroupM predicts that global ad investment will have increased by 3.4 percent ($17 billion incremental) by the end of 2015 and another 4.5 percent in 2016 ($22 billion incremental).
BRIC countries – Brazil, Russia India and China – will represent 23 percent of measured global ad investment in 2016, according to the agency. By comparison, the Eurozone now accounts for only 11 percent of global advertising.
While the U.K. is estimated to be the third-largest contributor to global ad growth in 2016 behind China and the U.S., France is forecast to see zero ad growth in 2016. Annual ad growth in the German and Italian markets is anticipated to fall only between 1 and 2 percent.
YouTube’s annual list of top 10 trending videos shows that this year’s most popular clips combined got around 470 million views on the platform. The number one YouTube video of this year is Watch Me (Whip/Nae Nae) by Silentó, which received more than 500 million views.
Below are the other nine. It is worth noting that four of them are TV spots.
Research company International Data Corporation (IDC) predicted that the worldwide Internet of Things (IoT) market will grow from $655.8 billion in 2014 to $1.7 trillion in 2020.
By then, devices, connectivity and IT services will represent more than two-thirds of the worldwide IoT market, with devices alone accounting for 31.8 percent of the total, according to IDC.
Alibaba brought in $14.3 billion in total sales volume on Singles’ Day, nearly one-third of which came during the first 90 minutes. This is a 60 percent increase from last year’s $9.3 billion day.
Mobile represents 68.7 percent of Alibaba’s total sales this year, compared to 43 percent last year. Mobile buyers on Alibaba’s Tmall.com and Taobao marketplaces reached 95 million this year.
“Marketing is a (Buyer) Journey, Not a Destination,” joint research by The CMO Club and IBM, shows that 57 percent of CMOs are going to spend more on content marketing. The split between traditional (52 percent) and digital (48 percent) spending is also nearly equal.
Content generation would be their biggest expenditure, accounting for 13 percent of their increasing budgets, followed by digital advertising (11 percent), traditional advertising (11 percent) and analog physical activities (11 percent).
As more and more brands are using Twitter as a marketing platform, it is worth knowing what type of Tweets are most common. Stats from inbound marketing platform HubSpot show that Twitter is becoming a visual social network, as 55 percent of Tweets contain a photo and 31 percent contain a link.
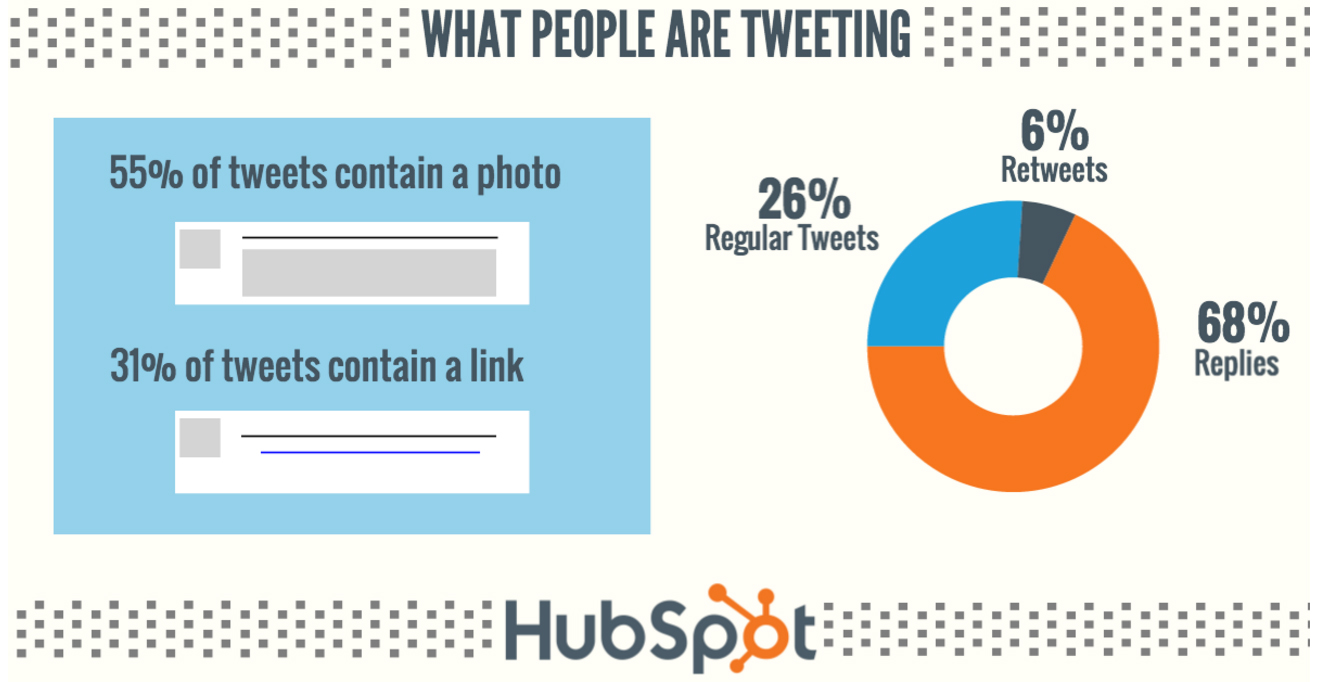
The same report also reveal that in general, 12 pm and 6 pm see the highest click-through-rate (CTR) on Twitter, while 5 pm gains the most retweets.
Leave a Reply
You must be logged in to post a comment.