Show me the money: proving your mobile site or app will deliver ROI
No mobile project should get the green light until there has been a thorough economic feasibility assessment to evaluate if the potential benefits will exceed the costs of developing, promoting and running it.
Conducting an economic feasibility study, which determines if your mobile site, web app or native app will deliver return on investment (ROI), is a critical stage of the feasibility assessment process.
Even if the technical, operational and schedule feasibility tests outlined in the previous column deliver favorable results, the board is unlikely to invest until they see the economics of the project are proven.
To be persuasive an economic feasibility report must:
This should be done for each of the different options for the project e.g. outsource v build yourself; web based v native app.
Noah Elkin, a mobile marketing veteran and co-author of Mobile Marketing: An Hour a Day?
ROI is a metric that generally catches the attention of the higher-ups. If you clearly establish the benefits you expect your strategy or a specific set of tactics to yield, it will be that much easier to justify investment in your efforts from those who control the cash flow. It’s a matter of thinking about it from their perspective.
Guides to conducting economic feasibility studies for mobile projects are hard to find – though this infographic by Kona is a useful introduction to mobile app ROI.
But you can apply a mobile interpretation to the methodologies for IT projects such as these by the departments of computer science at University of Waterloo and University of Toronto.
There are three steps to establishing benefits:
For a customer-facing site or app the goals, KPIs and financial value might be:
KPIs: media mentions; social media mentions.
Financial measurement of value: estimate how much achieving these KPIs would cost through other activates e.g. public relations or advertising.
Increased use of website by mobile devices and reduction in mobile users abandoning site.
KPIs: use web analytics to track the proportion of mobile users on the site, improved time on site; and conversions (e.g. sign-ups, sales).
Financial value: estimate how much achieving these KPIs would cost through other activates e.g. search engine marketing, PR or ads.
KPIs: increased store visits attributable to mobile. Attribution is tricky, but trackable through the redeeming of mobile vouchers instore, use of mobile ticketing, and monitoring the use of stock-checker or store finder tool on the mobile site.
Financial value: compare footfall attributable to other media and how much it would cost to generate a similar improvement in traffic e.g. via print or TV ads.
KPIs: sign-ups to email and SMS alerts; client use of click-to-call or click-to-email on mobile site to contact company with questions about product or services.
Financial value: as above, compare lead generation attributable to other media and how much it would cost to generate a similar improvement in leads e.g. via print or TV ads.
KPIs: direct m-commerce sales made via the mobile site; indirect sales instore or online that can be attributed to mobile.
Financial value: for m-commerce, calculate the number of sales made by people using mobile devices, track improvement and compare with total sales; calculating mobiles contribution to sales in other channels, e.g. where a product is researched on mobile, but purchased instore, is harder to attribute and quantify, but far from impossible.
KPIs: customer retention; return visits to mobile or physical store; sign-up for loyalty program, email or SMS alerts; mobile traffic to loyalty program site, download of loyalty app; redeeming of mobile vouchers or using repeat-buy discount codes.
Financial value: track increases in the proportion of sign-ups to loyalty program etc. attributable to mobile; estimate the cost of boosting loyalty sign-ups via other media.
The goals and KPIs will be different for an enterprise app. An enterprise app is one that is used internally with a company to “mobilize” its workforce i.e. give them access to corporate applications from the mobile devices.
These are measured in terms of productivity and cost savings for relevant departments: see Kony for more details.
It is also important to establish and track the goals and KPIs of the mobile site or app itself. But unless you are a start-up company where your site/app is your entire business, these should not be confused with the business goals above.
It doesn’t matter how many people use you website or app if it delivers no measurable improvement in brand awareness, loyalty, leads and, most importantly, sales.
Goals/KPIs of the website/app include:
When estimating benefits is important to stay realistic.
Noah Elkin:
If you’re a retailer, don’t compare usage frequency with Starbucks or time spent with Facebook, because chances are your customers won’t need to buy something from your store with the same regularity as they get their daily coffee or communicate with their social graph.
It is critical to calculate the entire cost of the project – that is everything from the conception of the project right through to the cost of decommissioning it at the end of its life.
It includes the costs of all criteria technical and operational feasibility tests. All the costs of design, build, launch, running and maintenance costs, scheduled updates, all related wages and training and, arguably the most important, marketing. Gartner calls this total cost of ownership (TCO).
The costs will be unique to each project, but – big or small – they will share a similar cost structure.
Magnus Jern, president DMI International:
What is the cost of developing a mobile app? This is one of the most common asked questions by clients. The answer is somewhere between zero and $40M. The zero option is using an online app tools such as AppMakr and the $50M could relate to a full enterprise mobility solution.
How much does it cost to develop a responsive website? Assuming like-for-like functionality, the total cost doesn’t differ that much from a native app, with the website perhaps coming in a bit cheaper.
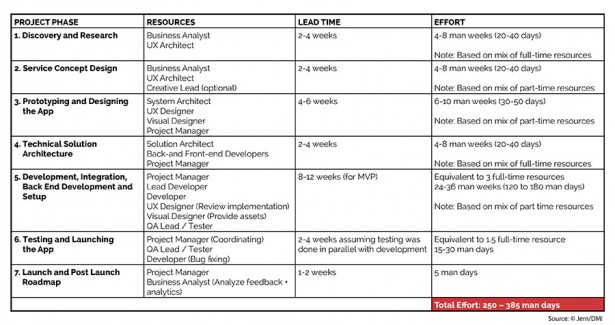
How do costs break down? The entire project will usually take up to 5-6 months to the initial release, but this is made up of seven phases. While development will be the largest of these, it terms of time and budget, it will be as little as 40 percent of the cost of the total project.
The phases are:
For each of these phases outlined by Jern you need to estimate the time – and thus budget – to complete all the tasks. In the following chart, Jern estimates the time required for each stage, in the development of a quality app or responsive site.
So what does that mean in cash terms?
Magnus Jern:
The rates per category for app development in US or UK are approximately:
The cost schedule above does not include the operational and promotional costs, which also need to be budgeted for.
Operational costs might include:
Mobile sites, web apps and native apps all need a promotional strategy.
As web properties simply require a user to click a link in search results, email, SMS, social media etc. marketing is less of a challenge for web than native apps, but will still benefit from an investment in search engine optimization (SEO), search advertising, email and social media marketing.
Native apps require the user to visit an app store to download the app to their smartphone (assuming they have the right type of device) which is likely to require considerably more marketing effort than web would.
It is not uncommon to see apps advertised on TV, billboards and print, as well as bombarding mobile users with web and in-app advertising.
Calculate the costs that will be incurred through your go-to-market strategy as you target users through:
It is also imperative take into account expenditure on search engine optimization (to improve where your web site/app appears in search results) and app store optimization (to help improve “discoverability” of you native app).
Mick Rigby, CEO of London-based mobile media agency Yodel Mobile:
The majority of mobile app developers reach the end of their development stage, then when they come to deploy the app find they have a huge hole in their marketing budget. The app stores are the most heavily contested marketplaces, so if there is insufficient budget to market and promote the app, it will die without anyone knowing about it.
If you want it to be discovered than yes, 80% of your overall app budget should go into marketing. This isn’t just about advertising, it also includes app store optimization and on-boarding as well as social, PR and external CRM.
For mobile websites or web apps you don’t need to spend as much on promotion. There’s a shorter user acquisition journey and a less competitive marketplace to advertise in. I’d recommend 50 percent of the overall budget.
There is no average spend. It really depends on the category and expectations. For example, to get your native app into the app store top ten for gaming – one of the most competitive categories – you would be looking at investing upwards of £150,000 ($214,000) a month in mobile advertising in the UK and three or four times that investment in the US.
The go-to-market strategy itself will be looked at in more detail in the next column.
Over time all projects deliver diminishing benefits, until eventually they become outdated, irrelevant and unused. Constant refreshing of content and a regular schedule of new versions, will stem this decay, but will not arrest it.
The rate of decay of native applications is particularly severe, due to the intense level of competition from competing apps for the limited amount of space on each user’s smartphone.
According to Flurry (2014) one half of native apps lose half their peak users within three months. Some app types have a better half-life than others: news (7 months on average), health, business, communication (all 6 months) and tools apps (5.5 months).
There is no equivalent study for mobile sites and web apps. But assuming a regular flow of new content, a good ranking on search engines and regular enticements to return in emails, SMS, social media and marketing materials, the half-life and thus life-span for a good web site/app should be measured in years as opposed to months.
There are several methodologies for calculating the cost/benefit of your project, two of the easier ones to understand are Payback analysis and Return on Investment (ROI).
This method calculates when the project will break even.
So, for example the total cost of the project including development, operational, promotion and running costs comes to $560,000 and the project delivers financial benefits of $150,000 in year one, $300,000 in year two, $250,000 in year three and $150,000 in year four.
This project will payback during year three, because by the end of year three the project will have generated $700,000 in cumulate financial benefits, which is greater than $560,000.
As the project has a life expectancy of more than three years, it is economically feasible. If the life expectancy was less than three years it would not be feasible. When comparing different projects or alternatives for the project, a shorter payback period is preferable.
To find the precise break-even point follow the methodology outlined by Castro and Mylopoulos.
This method is useful for comparing the profitability over the lifetime of the project between different alternatives e.g. outsource v build yourself; web based v native app. And between this project and others projects that are competing for the same investment funds.
So, if the life expectancy of the project is four years and the total costs over the period are $560,000 and the project delivers $850,000 in benefits over four years the ROI is calculated as follows:
Total benefits – total costs = $850,000 – $560,000 = 52%
Total costs $560,000
Repeat this process for the alternatives and compare which version is the most economically viable.
Note both of the Payback and ROI analysis have been simplified to explain the methodologies. For more in depth studies see Castro and Mylopoulos.
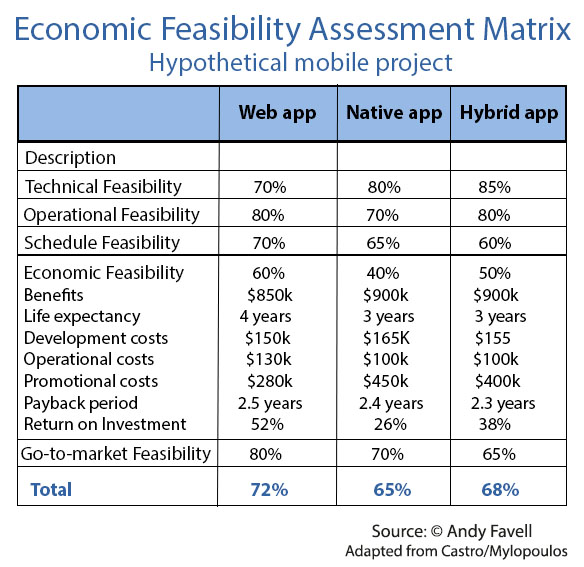
The following table shows how economic feasibility might be reported on feasibility matrix (numbers are for illustrative purposes only):
Magnus Jern:
Many enterprise apps have a return of investment in as little as three to six months with investments up to $500,000. The reason is simply that the cost savings and productivity increases are huge.
On the other hand most start-ups take at least 12-18 months before their app will break even and they can pay off the initial investment. 85 percent of all start-ups last less than three years which means that they will probably never pay off the original investment.
The next stage after completing your economic feasibility assessment is to evaluate your go-to-market strategy.
These will be covered in the next article.
This is the seventh part of the ClickZ ‘DNA of mobile-friendly web’ series.
Here are the others:
Andy Favell is ClickZ columnist on mobile. He is a London-based freelance mobile/digital consultant, journalist and web editor.
Contact him via Linkedin or Twitter at Andy_Favell.
Leave a Reply
You must be logged in to post a comment.