Nine free tools for measuring social ROI
It’s widely agreed across the marketing industry by now that social media is an important part of any marketing strategy.
And as with any marketing strategy, it’s natural to want to know what quantifiable impact it’s having on your business – known as the Return on Investment, or ROI.
The problem is, it’s a lot harder to put an absolute value on the benefits of social media than it is with other marketing campaigns. As Christian Arno wrote for ClickZ in his piece on whether we can truly measure social ROI, “Many companies have realized that social media does not generally function as an engine for direct sales and are moving away from strict return on investment (ROI) metrics.”
But that doesn’t mean there aren’t a number of things you can measure and track to gauge the benefits of your social media presence, and it definitely doesn’t mean you shouldn’t be tracking them.
The best way to define success on social media is to define what your goals are. Presumably you want to attract more customers to your business, but what does that look like on social media? Do you want to get more people mentioning your brand in their conversations, or directly engaging with and sharing your posts? Is your aim to direct traffic towards your website or shop, or to see your message reaching the widest audience possible?
Whichever of these you want to assess (or maybe it’s all of them), we’ve rounded up a great selection of free tools that can help you measure how your brand is doing on social and whether your social strategy is delivering the returns that you want it to.
Measuring reach, also known as impressions, on social media is one of the simplest ways to assess how many eyes (and ears) your brand updates are appearing in front of.
Getting a high number of impressions for a social post might not always mean that users are taking in or interacting with your brand message, but if your aim is simply to reach a wider audience, then looking at the reach for your social updates will let you know whether or not you’re succeeding.
A lot of social networks come with native analytics that will show impressions for your posts. Facebook Pages, for example, will display a ‘people reached’ figure below each post to show how many users have checked the update, and the Insights tab gives a broader overview of your page’s reach for different time periods, as well other metrics for page performance.

Similarly, on Twitter, you can click the little ‘graph’ icon below each Tweet to see how many impressions it has made on people’s timelines, or access Twitter Analytics to look at a whole range of analytics for your Twitter presence as a whole.
On Pinterest, registering a Pinterest Business account (which is free!) will give you access to Pinterest Analytics, which gives you data on the number of impressions and views your Pinterest profile is getting, as well as your top performing Pins.

Snapchat’s Stories feature also comes with some simple, basic metrics which will show you how many of your followers viewed and took screenshots of each of the Snaps in your Story. Because of the unique nature of Snapchat, there’s no way to passively or involuntarily receive content: a user has to engage with a Snap in order to view it, so reach and engagement are effectively one in the same.
If you want a more detailed look at your reach on Twitter, TweetReach is a useful tool. The free version will give you access to a “snapshot” of any hashtag, account username or keyword estimating how many impressions it has made and how many individual accounts have been reached by that term (or person).
The free snapshots only go back as far as a week with a limit of 100 tweets, so to get access to a more detailed analysis, you would need to upgrade to one of TweetReach’s paid options. However, the snapshots can be a useful ‘in the moment’ overview, and there’s nothing to stop you coming back any number of times to take additional snapshots over time, or to look up other keywords and hashtags to build up a bigger picture.

Much like with reach, many social networks come with their own simple analytics which will give you an insight into the amount that users are engaging with your content, from likes on Facebook and Twitter to retweets, link clicks and detail expands on Twitter and repins, clicks and likes on Pinterest. And, as we’ve established, every metric on Snapchat indicates an engagement of some kind.
So native analytics tools should be your first stop again for a free insight into how engaged people are with your social content. But if you want a more detailed look, or insight into a platform that doesn’t have free native analytics, here are some third-party tools you can use.
Simply Measured provides a range of free reports that give insight into user engagement across a number of different social platforms: mainly Twitter, Facebook, Google+ and Instagram with a little bit of Vine. The last two in that list (Google+ and Instagram) are particularly useful as the two networks don’t provide any free engagement analytics of their own.
The free reports are only available to social profiles below a certain size – e.g. up to 100,000 Circlers on Google+, up to 25,000 followers on Instagram – and do require you to give a bit in return. You have to fill in a capture form with basic details like name, email address and job title, and each report type has a one-time “cost” which is usually some kind of social promotion like a tweet or a Facebook like.
 You can probably tell I’m not a huge user of Instagram
The hoop jumping can be a bit annoying, especially if you want several different reports, but such is the price of a free lunch. The reports have some worthwhile insight to give, and I particularly like the ‘engagement as a percentage of followers’ stat on Instagram, which shows if your account is living up to its engagement potential (or exceeding it) as well as the comment keyword analysis for Google+.
Circle Count is a free tool for measuring and improving your performance on Google+. It works with both personal accounts and brand pages, providing a breakdown of the engagement on your most recent posts by type: followers, comments, +1s and reshares. It uses blue and red bars to show how much better or worse each post performed compared to the one before it – a neat way to track progress at a glance.

I found Circle Count’s layout a little scattered and difficult to navigate, but the most important pages are your Dashboard for personal analytics, and your Pages for a page overview. Alternatively, you can set up your Google+ Page to act like a profile and use it to sign in to Circle Count, which will then show Page analytics in place of personal ones.
Another useful feature is the Follow Map, which creates a heat map to show where your Google+ followers are located, helping you to tailor your social content geographically.
Knowing just how many people are talking about your brand on any given platform is a great way to measure how effective your social media campaigns and marketing have been. As well as tracking references to your brand, these same tools can be used to track any hashtag or keyword, which means you can also use them to measure the success of an individual hashtag campaign or competition, keep an eye on relevant phrases, and monitor your competition.
socialmention allows you to search for any word, phrase or hashtag and see where people are using it across the internet – in blogs, microblogs (which seems to be code for ‘Twitter’), bookmarks, images and videos. It can be useful for tracking not just where your brand name or hashtag is appearing on social media, but also on blogs and in articles.
socialmention also assigns some interesting metrics to your search term: ‘Strength’, denoting the likelihood that people will be talking about it on social media; ‘Passion’, which calculates how likely it is that people who are talking about your brand will do so repeatedly; ‘Reach’, which denotes your level of influence, and ‘Sentiment’, which weighs up the number of positive mentions of your brand against the negative ones.
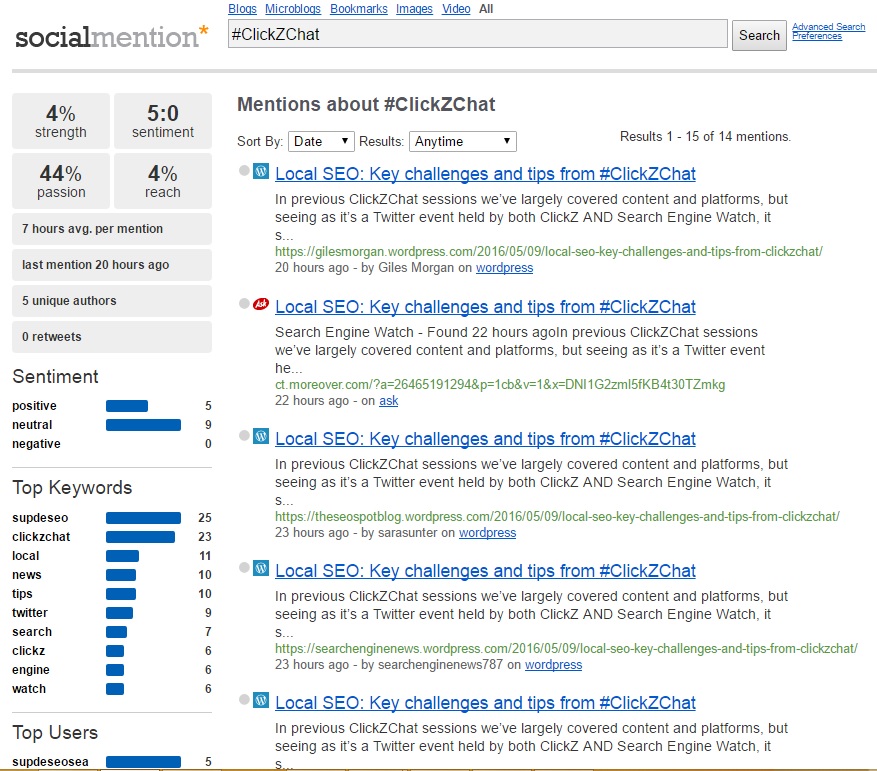
The main drawback of socialmention is the narrowness of its scope: the only social network it covers is Twitter, so to get a broader overview of how your brand or hashtag is doing on social media, you will need to supplement with other tools. Its blog coverage also seems to be limited to a few specific providers, but for a free tool it’s definitely worth exploring and making use of the data it provides.
Hootsuite is an all-round social media management tool that can be used to control and publish to several social media accounts from one dashboard, schedule posts, and track clicks via Hootsuite’s dedicated ow.ly links, which you’ve probably seen here and there on social media.
It also has a handy feature called ‘streams’ which allows you to monitor keywords, hashtags and search terms at a glance from multiple social networks (although the maximum you can register to a free Hootsuite account is three). Hootsuite supports Twitter, Facebook, Instagram, LinkedIn and Google+ Pages, as well as WordPress and YouTube.
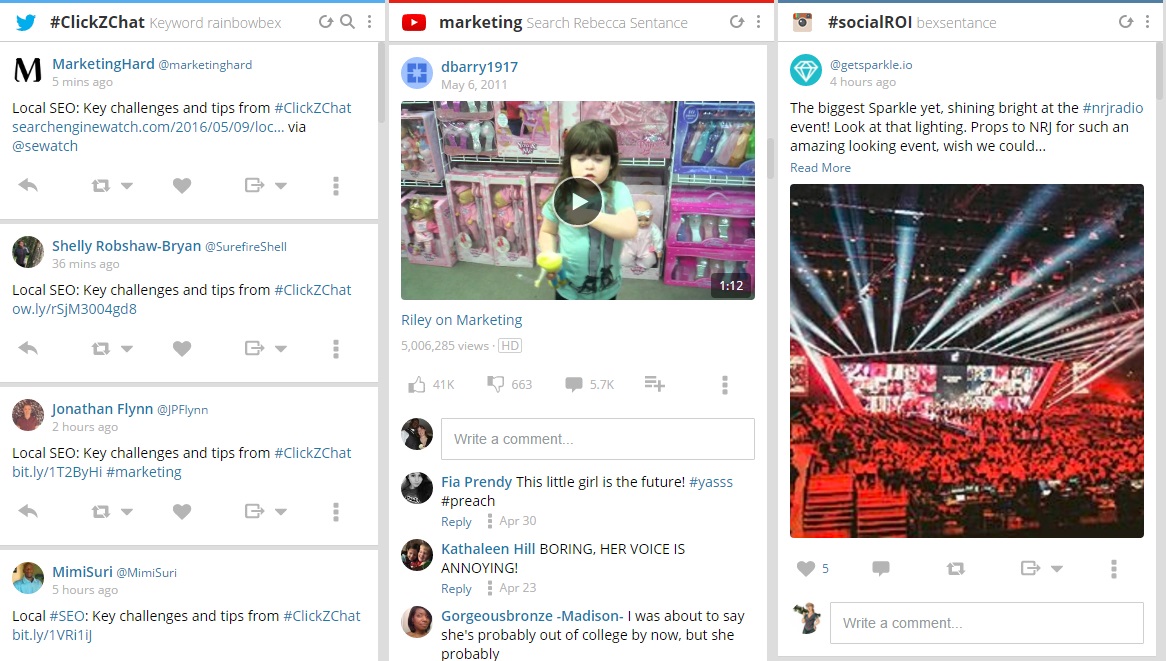
Keyword streams are mostly useful for monitoring a term or hashtag in real time, and Hootsuite doesn’t provide any kind of aggregated statistics or analytics about how your keywords are performing. Still, the multi-platform functionality is worthwhile, and you can get a sense of the size of a conversation as well as the key people using and interacting with a keyword if you check back over time.
Tagboard is a visual tool specifically for tracking uses of hashtags across social media, showing social updates which include the hashtag in a pinboard-style layout. Its main advantage over something like Hootsuite streams is its scope: it can track hashtags across Twitter, Facebook, Instagram, Google+, Vine and Flickr, instead of the three registered networks that Hootsuite’s free version limits you to.

Some might also find the grid layout more visually pleasing than vertical columns, although the effect can equally be a bit overwhelming. It’s also very easy to use: instead of having to set up individual social networks, you can just search your term and go.
After putting out some great content on social media, you obviously want to know whether it’s doing its job of luring new visitors to your site or shop, whether people are clicking through to your competition on the social platforms you promoted it on. You want to be able to see which social networks are most effective as a source of traffic for planning future campaigns, and which types of content perform better than others on social so that you can replicate them in future.
Here is a set of handy free tools that you can use to monitor your traffic from social media and get some insights into what is working and why.
Bitly is a link shortening tool which also allows you to track clicks on your shortened links and find out where your visitors are coming from. To get the most out of this tool, you really have to get into the habit of using Bitly links consistently for all your URLs, but the same can also be said of social media management tools like Hootsuite and Buffer which use custom links to track clicks.
If you shorten a URL into a Bitly link and share it on social media, you can see exactly how many users have actively clicked that link to be taken to your chosen destination. The link activity is aggregated in a ‘daily trends’ graph that allows you to see the peaks and troughs of traffic via that link. Bitly will also show you activity from other Bitlinks, which can be viewed by referrer so you can see where the traffic is coming from even when the link isn’t one you created.
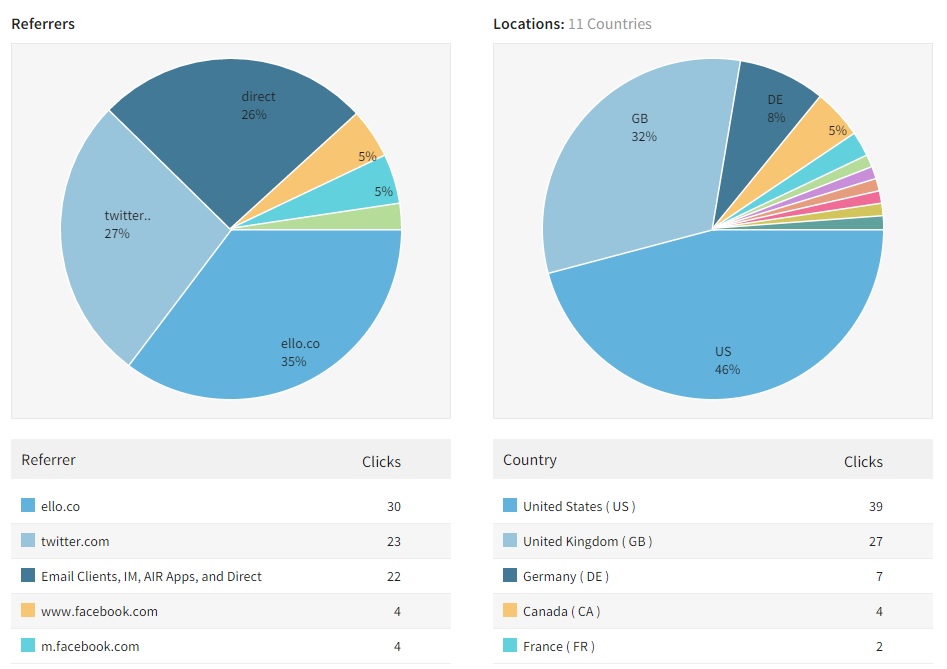
You can use Bitly’s tagging system to keep track of things like specific marketing campaigns, and there’s also a ‘Stats’ view that gives a look at more detailed analytics for all your links: clicks, saves, referring websites and the location of your visitors.
One of the biggest go-to tools for analytics of any kind is of course Google Analytics. If you can set up Google Analytics for your site (here’s a handy beginner’s guide on how to do that), there are a couple of different ways you can use it to find out how much traffic is coming over from social media.
The ‘Social’ section of Google Analytics, found underneath ‘Acquisition’, gives you a breakdown of how many sessions on your site come from different social networks, including sites like Stack Exchange, Pocket and StumbleUpon. You can look at the Network Referrals tab for data on how many page views came from each site, as well as the average session duration and pages per session for visitors from that network.

Google Analytics’ referral figures for social media are a good way to get an overview of how visitors are coming to your site and their behaviour, although their accuracy should be taken with a pinch of salt as some social traffic has been known to wind up in other sections of Google Analytics. (For example, iOS 6 traffic, regardless of source, gets filtered into Direct).
You can also use Google’s custom URL builder together with Google Analytics to track exactly which links social users are clicking on to get to your site – similar to the way that Bitly links can be used. Yuyu Chen explains how to add Urchin Tracking Module (UTM) parameters to your links to track social behaviour with Google Analytics.
As well as free reports on individual social channels, Simply Measured has a free report that works in conjunction with Google Analytics to give an overview of your site’s traffic from social media. The report contains a lot of the same data you will already have access to on Google Analytics, but presents it all together in an easy to read, highly visual style, and with some interesting extra insights like return visits, top cities, and a week-over-week and month-over-month percentage change.

For more on how you can track and measure social ROI, don’t miss Marc Ellam, Head of Passenger & Social Media and Digital Communications for Heathrow, speaking at Shift London on Tuesday 24th May. Register here!
Leave a Reply
You must be logged in to post a comment.