The internet as we know it today began with one of the first internet browsers, Mosaic, which launched in 1993 and was at the forefront of making the internet easily accessible to non-techies.
Just a couple years later, the real revolution of what the internet would become started with the launch of commercial sites such as eBay and Amazon in 1995.
And over the last 24 years, the internet has grown in use and usefulness exponentially, with mobile accounting for an ever-increasing share of our online activities. In this article, we’ll dig in a little deeper into internet usage today.
Some key facts to keep in mind around the global population:
Stats about internet users
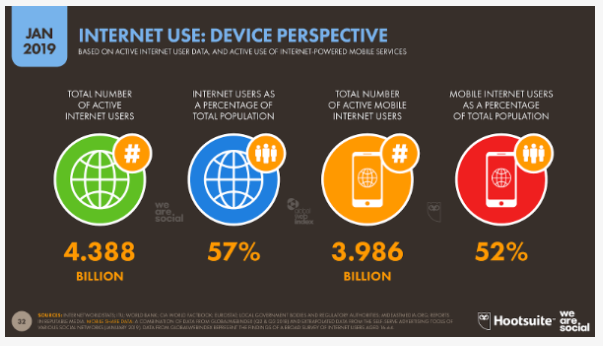
Growing at the rate of more than 11 users per second, or 1 million new users each day, internet users now make up 57% of the global population.
That also translates to about 4.4 billion people, which is a 9% growth from 2018.
Mobile internet users make up about 52% of the total.
Stats about time spent online
On average, people are spending 6 hours and 42 minutes online each day.
Google, YouTube, Facebook and Baidu dominate that time.
In addition, more than four million blog posts and 500 million tweets are published every day.
The daily rate of Google searches? Near five billion.
Stats about internet activity
Ecommerce
In 2018, global spend via ecommerce topped $2.8 trillion dollars with an estimated year-on-year growth of 14%.

Online travel accounted for the largest share of spending with $750 billion spent online for travel, accommodations, and bookings.
When looking at numbers from the point of influence (think Facebook ads), the internet influenced retail sales at the amount of $2.84 trillion in 2018. That number is projected to grow to $3.45 trillion in 2019 with $0.56 of every dollar spent at an offline store influenced by a digital interaction.
An estimated 1.92 billion people are expected to make an online purchase in 2019. In the US alone, 80% of internet users are expected to make an online purchase.
Amazon has grown to become an eccommerce giant accounting for more than 49% of all online sales, and 5% in U.S. retail sales.
Search
As of March 2019, Google continued to dominate the search engine market with a market share of 92.46%.
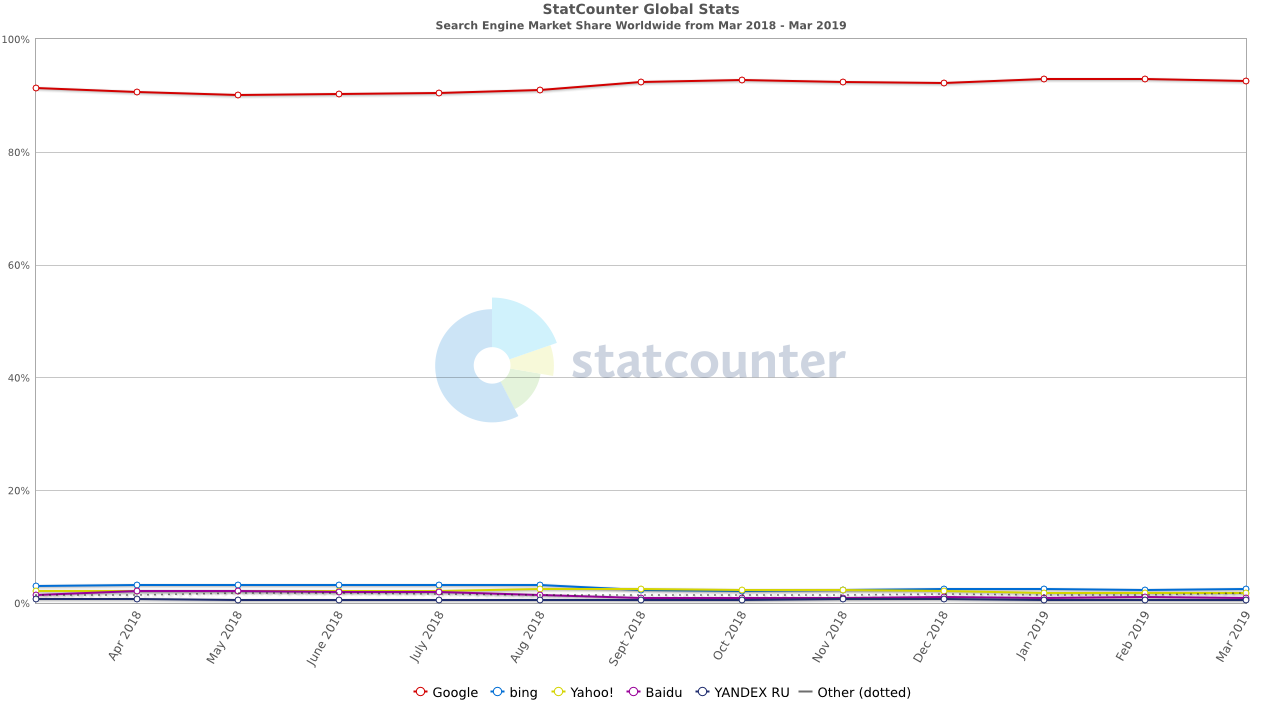
They are followed by Bing at 2.45%, Yahoo at 1.82% and Baidu at .95%.
The first position in a Google search is rewarded with a click-through rate of 34.36% for desktop, and 31.35% for mobile.
Ad blocking
Over 46% of users in North America, 45% in Latin America, 52% in Asia-Pacific, and 47% overall worldwide utilize ad blockers on their desktop, mobile, and tablet devices.
The growing use of ad-blockers is tied to reasons of seeing too many ads, to seeing irrelevant ads, to finding ads too intrusive. It is estimated that ad blockers will costs business $75 billion annually by 2020.
Video
According to GlobalWebIndex, 92%, of internet users (or 4 billion people) watch videos online each month. For context, just around 6 billion people around the world have a television set at home.
YouTube alone has over 1.5 billion users logging in each month.
Of the total population of internet users:
- 58% stream TV content
- 30% stream gaming content
- 23% watch live streams of gaming content
- 16% watch sporting tournaments
Social media
With over 288 million new users in the last 12 months alone, social media numbers have grown to almost 3.5 billion users worldwide.
The average time spent on social media sites is about two hours and 22 minutes each day, up from 2 hours and 15 minutes last year.
Facebook, while having had a few scandals in 2018, continues to lead the social media pack with 1.52 billion users, a 9% increase over last year.
Instagram also continues to grow with a reported 1 billion active accounts. Of those accounts, reportedly more than 60% of users log in each day, and share more than 95 million photos and videos daily.
While still going strong, Twitter is reporting a loss of 9 million users in 2018, (down 2%) but a total of 321 active users.
The once popular and growing site, Snapchat, has also seen a decline in active users in the last year, down 10%, landing at 306.5 million users.
Stats about preferred device for accessing the internet
Voice
A more recent development in the ways in which people are interfacing with the internet is changing too.
The use of voice control tools (such as Alexa) have increased significantly:
- 58% of users use voice commands to conduct business information searches
- 27% use voice to find a website
- About two in every five internet users use voice commands for search functionality, every month
This increase of use could be attributed to higher rates of voice command usage matching lower levels of literacy in developing countries.
Mobile
One the most interesting developments is the rapid growth of mobile use.
Mobile has more than 4.68 billion users as of January 2019, an increase of approximately 100 million from 2018.
And mobile traffic was responsible for 52.2% of internet traffic in 2018, up from 50.3% in 2017.
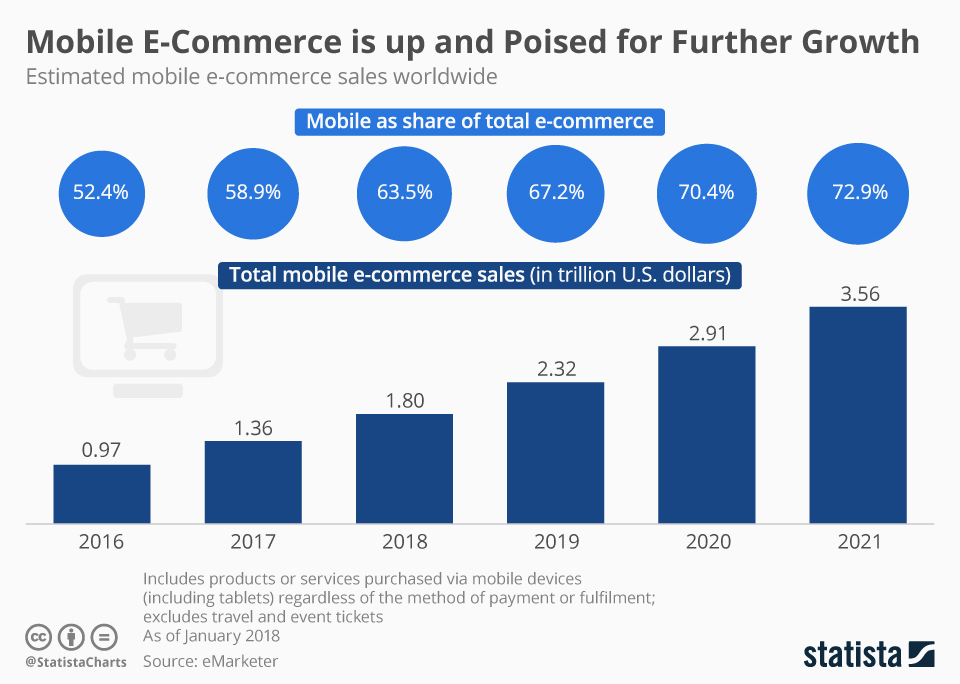
By 2021, we can expect that worldwide mobile ecommerce will account for 72.9% of all retail ecommerce, up from 58.9% in 2017. That represents about $2.32 trillion of ecommerce sales.
In China, about 75% of ecommerce sales are done on a mobile device. In addition, 82% of people use their mobile device to research a purchase they’re considering making in brick and mortar. Mobile is also responsible for 92% of Facebook’s ad revenue.
Desktop
PC usage is also on the decline, while in 2018 it accounted for 41% of total IP traffic, by 2022 that is projected to drop to 19%. Since 2014 mobile internet use has been on the rise starting at just 24% of total internet net time on a mobile device in 2014 and landing at 48% of total internet time spent on a mobile device in 2019.
Stats about websites
As of April, 2019 there are approximately 1.5 billion websites worldwide.
Domain name registrations have grown by over 3.5% year over year with 342 million registered domain names as of third quarter 2018.
43.59% of all domain names utilize the ‘.com’ extension.
GoDaddy leads the pack for domain name registration having registered 19.29% of all domains as of December 2018.
WordPress, with a 59.7% market share and 22.6 million actives sites, dominates the world of CMS. The New York Times, Forbes, and the Facebook Blog are all WordPress sites.
The top five most visited websites are:
- Google (Average visit time: 8 minutes, 17 seconds)
- YouTube (Average visit time: 8 minutes, 43 seconds)
- Facebook (Average visit time: 9 minutes, 43 seconds)
- Baidu (Average visit time: 7 minutes, 15 seconds)
- Wikipedia (Average visit time: 4 minutes, 11 seconds)
What other internet stats have we missed? Leave a comment below!
Leave a Reply
You must be logged in to post a comment.