The numbers for mobile subscribers and mobile web users in China are mind blowing, but when the enormity of the population is taken into account, how does China compare with the US on mobile?
In the previous column, we compared how the largest Chinese and US companies – specifically banks, retailers and internet companies – were performing and reporting their mobile performance. The conclusion: US companies – particularly the big US retailers – have a lot to learn from their Chinese contemporaries.
In this column we are going to consider if the mobile opportunity in China is larger than in the US. This might help explain why Chinese companies appear to take mobile more seriously than US companies.
When you want to rate and compare the size/potential of the mobile market in a given country there are a number of key metrics to take into account.
These criteria vary a little by business vertical, but for retailers and other companies interested in m-commerce, these following are a good starting point (with some headline stats):
- Smartphone sales (China: 2.5x North America).1
- Smartphone penetration (US: 72%; China: 58%).2
- 4G subscribers (China: 2.3x North America).3
- 4G coverage (US: global rank 7; China: rank 16).4
- 4G speed (China: rank 31; US: rank 55).5
- Mobile internet users (China: 8x US).6
- Mobile commerce (China: 4x USA – est.).7
Sources (full details and links in sections below): 1. Canalys; 2. PEW; 3. China mobile operators; 4. Open Signal; 5. Open Signal; 6. CNNIC; eMarketer; 7. Analysys; eMarketer.
For the purposes of this column, the population of China is taken to be 1,371.2 million and US 321.4 million (Source: World Bank)
Smartphone sales
China is the world’s largest smartphone market, by miles.
Smartphone sales in China are approaching half billion units annually, which is about one third of the global market, (Source Canalys, August, 2016).
As shown in the graph, the Chinese market is more than 2.5 times the size of entire continental market of North America (the size of the US market wasn’t specified).
To put this in perspective: to match smartphones sales in China market every man, woman and child in US (321.4 million) would have to buy a new smartphone every eight months.
Why do analysts count smartphones? People with smartphones are more likely to spend more time surfing the web, because the experience is more enjoyable than on a feature phone and smartphones tend to come with more generous data allowances.

Smartphone penetration
Arguably more important than smartphone sales is market penetration. Generally data suggest that a larger proportion of US people use a smartphone – today. But with the high purchase rate in China, we should expect the gap to narrow.
N.B. There is no standard for calculating penetration – so analysts might be measuring the proportion of smartphones among: mobile connections; unique mobile users; or the population.
Also results are often based on surveys (sometimes quite small ones). This is why valuations vary and comparisons between countries/sources are tricky.
- A survey by Pew estimates that smartphone penetration in China was 58% in spring 2015, compared with 72% in the US. The global median was 43%. (Source: PEW February 2016).
- The GSMA estimates there were 890 million smartphone connections in China, at the end of 2015, with a smartphone adoption rate of 68% (Source: GSMA June 2016).
- ComScore estimates that 199 million people in the U.S. owned smartphones in February which is a penetration rate of 79.3 percent mobile market penetration (Source: ComScore April 2016).

Mobile broadband in China: 4G subscribers
Arguably a smartphone without a data connection isn’t smart at all… it’s just a phone.
This is why it is important to study both the number of mobile broadband connections and the geographical coverage in a country. 3G or “third generation” mobile networks and handsets are gradually being upgraded to so-called 4G networks, which are usually based on LTE technology. 4G networks have more data capacity, which mean faster web performance and better video and audio playback.
According to Open Signal (see below) the average speed of a 4G LTE mobile connection worldwide at the end of 2015 was 13.5Mbps compared with 3.5Mbps for 3G, 0.1Mbps for 2G and 6Mbps for WIFI.
The three main Chinese operators share 591 million 4G customers between them out of a total 1.3 billion mobile subscribers or 45% of total subscribers.
- China Mobile has 429 million 4G customers (133 million still on 3G) out of 837 million customers. Handset data traffic on the network is 1,252 billion MB (Source: China Mobile Q2 2016).
- China Unicom Monthly has 72 million 4G customers (it no longer reports 3G users) out of 260 million customers. Handset data traffic is 327 billion MB. Unicom also shares ARPU average revenue for user which is RMB 79.4 (US$ 11.9) for a 4G user, compared with RMB 47.3 (US$ 7.1) for and average user (Source: China Unicom Q2 2016).
- China Telecom has 90 million 4G customers (it no longer reports 3G users) out of 207 million customers. Handset data traffic is 15kTB (est. 15.2 billion MB?) (Source: China Telecom Q2 2016).
The excellent thing about the Chinese operators is that they have been sharing performance data on the same page on the website for many years.
This makes it very easy for investors, analysts, journalists, government agencies, business partners and customers to easily source and compare to get the information they require.
Mobile broadband in US: 4G subscribers
To find data from US operators, requires hunting through earning releases, PDFs, presentations etc. Despite performing this tedious trawl, I was unable to ascertain 4G subscriber numbers for either AT&T or T-Mobile at all.
This makes it impossible to find any meaningful comparison between US operators or between the US and China.
As readers of the previous column (which compared mobile disclosures of Chinese v US banks, retail and internet companies) will already have noted: public companies in US (and other western countries) have a lot to learn from their Chinese contemporaries about data transparency when it comes to mobile performance.
- Verizon has 88.9 million 4G devices on the network, which is 79% of retail connections (113 million); smartphone penetration is 86% of total connections. (Source: Verizon Q2 2016)
- AT&T – no 4G subscriber numbers available in annual report or Q1, Q2, 2016 (Source: AT&T)
- T-Mobile – no 4G subscriber numbers available in annual report or Q1, Q2, 2016 (Source: T-Mobile)
- Sprint – 4G subscriber numbers unclear, but has approx. 18.5 million Tri-band LTE phones on network, which is 31% of total connections (Source: Sprint investor update Q1, 2016)
Ovum estimates that there are 253 million LTE subscriptions in North America (Source: Ovum Q1 2016, via 5G Americas). This is 57% of subscribers, which is larger than China’s 45% penetration, calculated from the operator stats.
Even taking into account that Ovum’s North America numbers will include Canada, possibly Mexico and others, this suggests that the US LTE share must be substantial, and thus that AT&T and/or T-Mobile must have a significant 4G subscriber base, which makes it surprising (as well as frustrating) that the companies don’t share the data.

Mobile broadband: 4G speed and coverage: China v US
What’s the point in having a 4G phone and data contract, if you have no coverage?
All customers, but businesses in particular, really need to know which of the available operators has the best coverage in their region. Imagine how important this will be for M2M based services, which require an always on fast connection… machines, obviously, can’t go outside to get a better signal.
A useful source (there are others) for 4G coverage and speed is the crowd sourcing app Open Signal, which sits on users phones passively monitoring operator performance, it then collates and compares the results for different countries, based on average speeds of the operators.
4G/LTE coverage:
- The first chart (below) measures 4G/LTE coverage, based on the proportion of time the average LTE users’ handset in that country remains connected to the operator’s 4G network.
- US achieves a coverage of 81%, which ranks it 7th in the world; China achieves a 76% coverage ranked it 16th. Just to put these impressive performances in perspective: the UK which is much smaller nation geographically than either US or China scores an embarrassing 53%, ranked 55th in the world. (Source: Open Signal, Q4 2015).
4G download speed
- 4G download speed, shown in the second chart, is different matter. China is ranked 31st with an average download speed of 14Mbps while the US is in the slow lane ranked 55th with 10Mbps.
- To put these speed scores in perspective: the fastest 4G speeds globally are enjoyed in Singapore at 37Mbps. The average is 13.5Mbps. UK is ranked 29th with 15Mbps, slightly ahead of China. (Source: Open Signal, Q4 2015).

When you break down these national scores, OpenSignal reveals ratings for five US operators, but only one Chinese operator (albeit the world’s largest operator).
- Verizon: national 4G coverage 87%; 4G speed 12Mbps
- AT&T: 83%; 8Mbps
- T-Mobile: 81%; 12Mbps
- US Cellular: 75%; 6Mbps
- Sprint: 70%; 7Mbps
- China Mobile: 77%; 14Mbps
Looking forward to 5G
Ericsson predicts that by 2121 China will have 1.2 billion 4G connections, one quarter of the global total. (Source Ericsson Mobility Report Q1 2016)
That’s means that in five years 87.5% of the Chinese population will have a 4G connection. However by then China will also have already launched 5G services (which will deliver much faster download speeds).
GSMA Intelligence (Mobile Economy Asia Pacific, June 2016) expects China challenge US for leadership in 5G:
Asian markets such as South Korea, Japan and China are driving the development of 5G mobile technologies, in a similar way to how Europe pioneered 3G and North America led 4G.
With high or rapidly growing levels of 4G adoption, supportive governments and ambitious launch targets (linked to flagship sporting events), operators in these countries are challenging North American counterparts such as Verizon, which is initially focusing on 5G as a fixed-wireless solution. We expect to see some kind of commercial 5G launch in all three countries by 2020, despite the fact that 5G standardization is not scheduled to be completed until then.
Mobile internet users: China
As you’d expect, China is the world’s largest community of mobile web users. But when you take into account the size of the population, the penetration rate is has a long way to go to catch up with the US.
The main difference between China and the US is the proportion of web users who are mobile only. In China one quarter of web users only use mobile devices to access, never a PC. In the US this is one tenth. It is growing rapidly in both countries.
According to CNNIC (China Internet Network Information Center) China has 656 million mobile web users as of June 2016, which is 92.4% of total internet users (710 million). Of particular note is that 24.5% of Chinese Internet users are mobile only.
This suggests that 47.8% of the Chinese population are mobile web users.
CNNIC’s six-monthly reports are a gift to all fans of mobile/internet stats. The latest (38th) report wasn’t available in English at the time of writing. These stats are from a (Google) translation of the press release.
Mobile internet users: US
The US doesn’t have an agency like CNNIC, issuing regular web/mobile updates, but you can get an idea from analysts.
eMarketer estimates there were 259.7 million internet users in the US at the end of 2015. Of these 236.6 million (91.1%) are mobile web users. 27.8 million (10.7%) are mobile-only web users. (Source: eMarketer March 2016)
This suggests that 80.8% of the US population are mobile web users.
Mobile commerce: China
M-commerce in China is huge. Perhaps four times as big as the US. It is also a much more significant proportion of both e-commerce and total retail sales.
CNNIC estimates that 339.7 million Chinese people regularly engage in m-commerce, at the beginning of 2016. (Source: CNNIC January 2016). This is 82.2% of total ecommerce users and 24.8% of the population.
In Q1 2016 the Chinese m-commerce market was worth an estimated RMB 747.68 billion (US$ 111.96 billion). While year-on-year growth rate is slowing it is still a stunning 109.6%. Mobile accounts for 70% of all e-commerce transactions. (Source: Analysys August 2016)
To put these in perspective; if the China’s quarterly m-commerce remained the same for the rest of 2016, m-commerce in China would be comparable as the GDP of countries such as Iran, Thailand or Austria – all Global top 30 countries (Source: Wikipedia/World Bank).

Mobile commerce: US v China
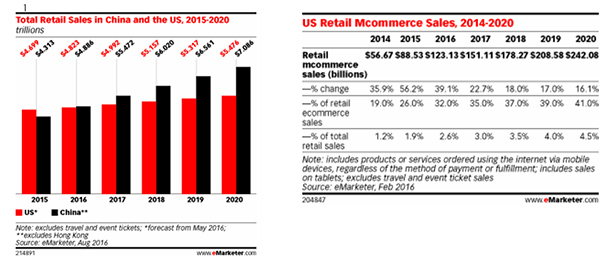
Retail m-commerce in the US is predicted by eMarketer to be worth US$ 123.13 billion for the whole of 2016, with an annual growth rate of 39.1%. Mobile will account for 32% of ecommerce and only 2.6% of total retail sales in the US (Source: eMarketer, May 2016)
Assuming the Analysys and eMarketer analysts are comparing similar data, this means that Chinese mobile consumers spend almost as much in one quarter as US mobile consumers spend in one year. If spending continues at a similar rate throughout the year (a conservative estimate), Chinese m-commerce would be four times as big as the US.
Compared with the relative populations – four times as many people live in China as the US – this is not so surprising. But when you consider that total (offline/online) retail expenditure in both countries is very similar – see stats from eMarketer (August 2016) below – the differential becomes much more significant.
Mobile commerce: competition: China v US
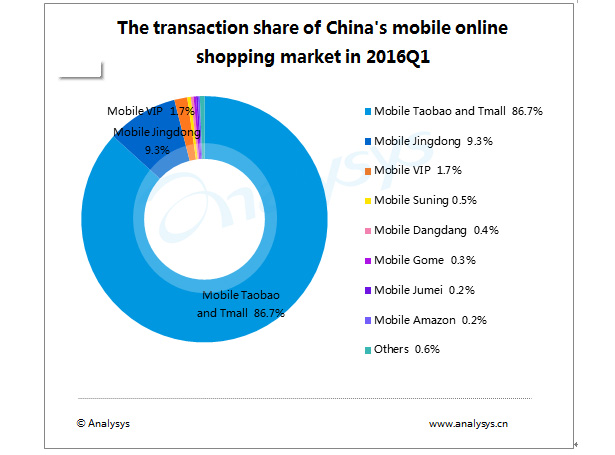
The outstanding thing about m-commerce in China, apart from the size of the market, is the domination of 96% of the m-commerce market by just two vendors.
- Mobile Taobao and Tmall (the multivendor internet marketplaces of Alibaba Group) has 86.7% market share according as of Q1 2016.
- com (the direct to consumer vendor, formerly known as Mobile Jingdong) had 9.3%; (Source: Analysys August 2016)
Numbers are less clear on the US m-commerce market, but it appears that it is more competitive. Forrester reportedly estimated in October 2015 that Amazon and eBay share one third of US m-commerce.
Conclusion
On sheer numbers – smartphones, 4G subscribers and mobile web users – China is undoubtedly the king of mobile, but when you take into account the size of the population the US comes close on penetration, and leads on some measures including smartphone penetration.
For most US companies the mobile internet opportunity is almost as compelling as it is for their Chinese counterparts.
Where China really excels is m-commerce. This market isn’t just huge, it’s also growing very rapidly. Mobile dominates e-commerce, accounting for a 70% share. It accounts for a much larger share of total retail than it does in the US.
The fact that two companies control m-commerce in this vast Chinese market is a bit alarming. It may discourage companies from taking the independent route, rather than using Alibaba’s Taobao or Tmall.
The m-commerce opportunity in the US is still one of the largest in the world. But the retail business needs to start asking why mobile still plays second fiddle to e-commerce and why it is still such a small percentage of retail as a whole.
Read the reports:
DNA of a Great M-Commerce Site Part 1: Planning
DNA of a Great M-Commerce Site Part 2: The 12 Pillars of Mobile Design
This is Part 29 of the ClickZ ‘DNA of mobile-friendly web’ series. Here are the most recent chapters:
Leave a Reply
You must be logged in to post a comment.