Adobe unveils Customer Journey Analytics with new Adobe Analytics UI
Adobe is making real-time omnichannel customer data and profiles from the Experience Platform available through a Customer Journey Analytics feature in Adobe Analytics.
Adobe is making real-time omnichannel customer data and profiles from the Experience Platform available through a Customer Journey Analytics feature in Adobe Analytics.
In March, Adobe made its Experience Platform globally available, integrating real-time customer data from multiple sources into profiles that could employed to personalize content or offers across all its clouds.
Previously, Adobe Analytics product marketing manager Nate Smith told ClickZ, multiple data sources had been available for profiling in such Adobe tools as Audience Manager, but they were not from as many sources, the data wasn’t as well integrated, and the resulting profiles were not as readily available to other Adobe tools.
Today, Adobe is making the real-time omnichannel customer data and profiles from the Experience Platform available through a Customer Journey Analytics feature in Adobe Analytics. A new data visualization interface for Adobe Analytics now lets users more easily relate data sets to each other, and to drill down into the real-time data with drag-and-drop capabilities that the company said were inspired by how its graphical tool Photoshop works.
Adobe has used real-time customer data for years, Smith pointed out.
But “before AEP [Adobe Experience Platform] was released,” he added, “we had all these applications and a lot of duct tape behind the scenes.” The new AEP integrates and combines data from many sources into profiles that can be used throughout the Adobe ecosystem to define how a publisher responds to a user.
The company also had the ability to look at customer journeys before, he noted, but it was “more difficult” and often based on user session data that was derived primarily from visits to web sites, and the profiles were based in Audience Manager.
Now, the profiles are based on data from multiple sources beyond web browsing, such as offline and third-party as well as online data, they are available throughout all Adobe tools, and they are informed by insights from Adobe’s AI layer, Sensei.
This combo of more integrated omnichannel data with data visualization, Smith said, makes it easier to undertake such tasks as comparing segments of users, finding what types of customer journeys more often lead to sales, or see the types of digital experience that are more likely to drive foot traffic in physical stores. The key, he said in a blog post, is using data layers to analyze customer journeys, just as Photoshop uses data layers for image creation.
“Brands can curate metrics,” he wrote, “such as orders, conversion and visits—across different channels with Adobe Experience Platform—and drag-and-drop layers of data together to uncover new insights about how customers engage with the brand. It provides many different lenses into the overall customer journey.” Here’s a screenshot of a typical screen in the new Analytics:
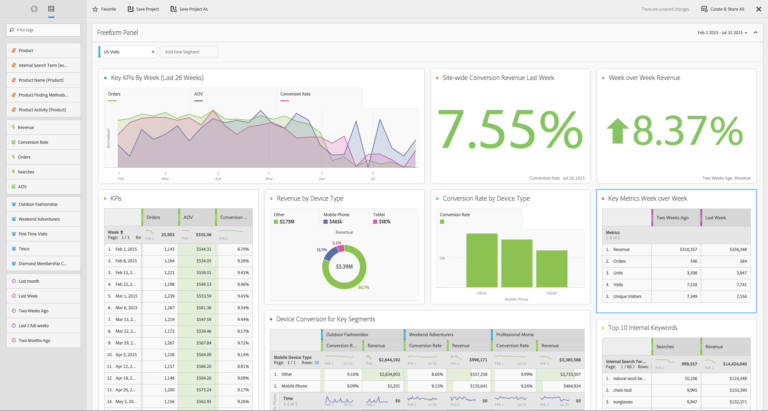
Pre-build AI/machine learning models can be trained to make better predictions from the customer journeys, the company said, such as when certain kinds of users are more likely to de-activate their subscriptions. Additionally, behavior from different devices can now be merged, thanks to a new Cross-Device Analytics in Adobe Analytics.
The redesigned user interface for Adobe Analytics allows a user to drill down in data through a visual-based interface. Previously, Smith said, its analysis of customer journey data operated more like a data dashboard with a stream of queries. Now, he said, users can more easily see different comparative views or drill-downs through an interactive, graphically-oriented interface.
As an example use case, Smith noted that he recently bought some new golf clubs at a sporting goods store, including a new driver. At the store, he agreed to become part of the retailer’s rewards program.
In the first email from the rewards program, the store offered him 25% off a new driver — for the one he had just bought.
That glitch in customer experience, Smith said, was probably because the sporting goods store’s email team, the rewards team and perhaps other units used customer data that wasn’t real-time, wasn’t available from all sources like point-of-sale, and wasn’t integrated into a single profile.
The new AEP, Customer Journey Analytics and Adobe Analytics front-end, he said, are intended to make it easier for marketers and other managers to see exactly what a given customer has purchased, or has responded to a message, before sending new marketing.
Leave a Reply
You must be logged in to post a comment.