Comscore’s new trends report reveals significant spike in US OTT usage
We unpack Comscore’s latest State of OTT Report which looks at OTT consumption trends since March 2020 including COVID-19’s impact, device usage, and top streaming services.
We unpack Comscore’s latest State of OTT Report which looks at OTT consumption trends since March 2020 including COVID-19’s impact, device usage, and top streaming services.
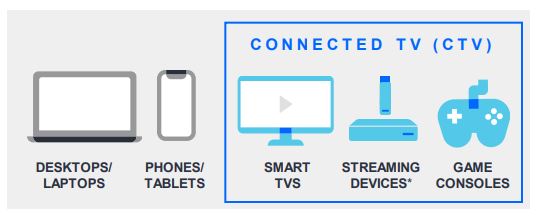
According to the IAB’s digital video glossary, the umbrella term for TV that’s connected to the internet is “Advanced TV.” Per the IAB, advanced TV is “any television content that has evolved beyond traditional, linear television delivery methods.” There are two common terms associated with ATV that we’ll address in this post. They are connected TV (CTV) and over-the-top TV (OTT).
You can’t have CTV without an OTT device. Over-the-top TV devices include streaming boxes/sticks, gaming consoles, and Blu-ray players as well smart TVs. For example, Google Chromecast is an OTT device.
You plug it into your TV’s HDMI port and it enables you to stream content from multiple entertainment apps such as Hulu, Netflix, and Spotify.
Smart TVs dispense with the external OTT device. They can connect directly to a variety of streaming services on their own.

Samsung Smart TV—Source: Samsung
A key distinction when trying to understand over-the-top TV content versus all streaming video content is that OTT only refers to content streamed on TVs versus computers or mobile devices.
Over-the-top includes subscriptions from video on demand (SVOD), free VOD, and transactional VOD such as iTunes or Amazon on demand.
Comscore’s State of OTT report, published in June 2020, unpacks the recent shifts in OTT viewership as a result of COVID-19 and touches on overall OTT trends in 2020 versus 2018 and 2019.
The report looks at OTT consumption data from over 75 OTT services, covering “the overwhelming majority” of OTT usage in the U.S.
Unsurprisingly, over-the-top TV consumption spiked significantly from February to March of this year, based on average daily streaming hours per household.
The following chart illustrates that the number of households that streamed content on OTT devices rose from a relatively flat 44 million per month before March 9, 2020 to roughly 300 million after, and has stayed in the 300 million household range since then.
 Source: Comscore The State of OTT Report (June 2020)
When Comscore compared over-the-top TV usage to the same time period in 2019, they found that the spike in usage was not an issue of seasonality.
OTT wasn’t the only type of TV consumption affected by the virus. Comscore’s research revealed that TV consumption rose on desktop and mobile devices from 43 billion visits in February and March to 64.3 visits in April, with a slight drop off to 59.6 billion visits by the end of May.
The “Big 5” streaming services which include, in order of volume, Netflix, YouTube, Amazon Video, Hulu, and Disney+ together accounted for 83% of over-the-top streaming hours in April 2020.
Comscore noted that other streaming services have an opportunity for growth, based on a combined 17% increase in hours per household for HBO Go, Spotify, Pandora Radio, and others.
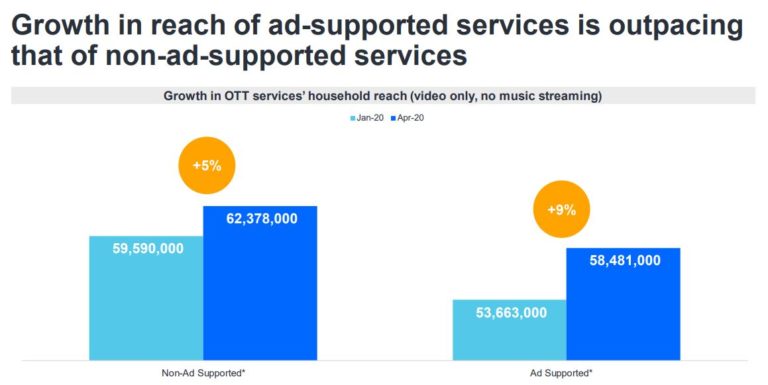
From an advertising perspective, there is tremendous potential to reach more households via ad-supported services, the growth of which is outpacing non ad-supported services (as demonstrated in the following table):
 Source: Comscore The State of OTT Report (June 2020)
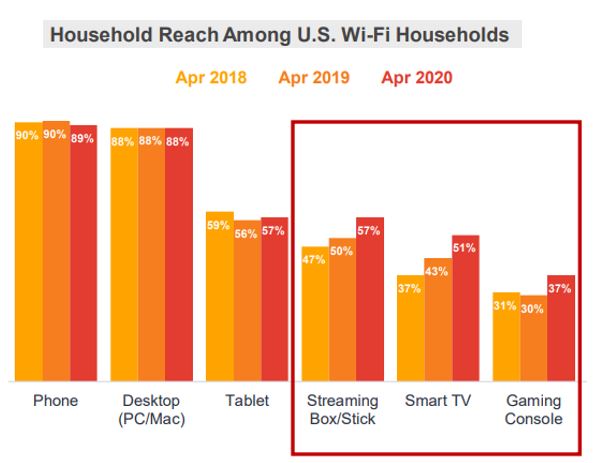
When Comscore compared the household reach of streaming video based on device-type (e.g., PCs/laptops versus CTVs), they found that traditional devices were still more prevalent than CTVs.
This trend, however, is beginning to shift when compared to April 2018 and 2019.
While consumers’ use of phones, desktops, PCs, and tablets has been fairly consistent year over year from 2019 through 2020, the use of CTVs including streaming boxes/sticks, Smart TVs, and gaming consoles all saw a marked increase in 2020 versus the previous two years.
 Source: Comscore The State of OTT Report (June 2020)
The most significant jump in CTV usage was for smart TVs, which reached about 37% of households in April 2018 versus 51% in 2020.
One of the most interesting findings in the Comscore report was just how mainstream over-the-top TV viewing has become, reaching nearly 70 million homes in the U.S., an increase of 5.2 million YoY. Other fun stats:
While OTT devices and usage of subscription services like HBO Go are on the rise, people aren’t quite ready to cut their cable TV cord. Comscore found that nearly 60% of CTV viewing households still subscribe to a cable or satellite service.
When compared with traditional TV and DVR viewing, OTT and VOD (video on demand) saw an increase in total viewing households from February to April 2020 versus the previous year. The latter two formats saw slight decreases.
Likewise, people are spending more time watching OTT video compared with DVR—but just barely. The latter has just begun to exceed the former this year compared with last.
Comscore’s conclusion, as of June 2020, is that the increase in OTT usage is holding steady since March. This includes an increased reach of ad-supported services, which presents an opportunity for marketers who want to reach OTT-connected consumers.
The consumption of over-the-top TV content is increasing based on the overall number of consumers and usage hours. It remains to be seen whether this trend will continue once the immediate threat of COVID-19 has passed and there’s some semblance of normalcy restored to our lives.
Even so, the trend of OTT adoption, particularly via smart TV usage, warrants scrutiny. It is likely that consumer viewing behavior will be permanently impacted for the foreseeable future.
Leave a Reply
You must be logged in to post a comment.