87% consumers use a second device while watching TV: How to connect marketing data
Consumers' path to purchase has never been more wayward -- which leaves marketers with the big challenge of connecting data from disparate sources.
Consumers' path to purchase has never been more wayward -- which leaves marketers with the big challenge of connecting data from disparate sources.
Just last night I was watching a new Amazon series on my desktop while tweeting about it on my smartphone, which is quite a long way from where we started with slow dial-up at a family computer in the early days of the internet. Now, most of us are connected pretty much all the time, on devices ranging from our watches to our refrigerators.
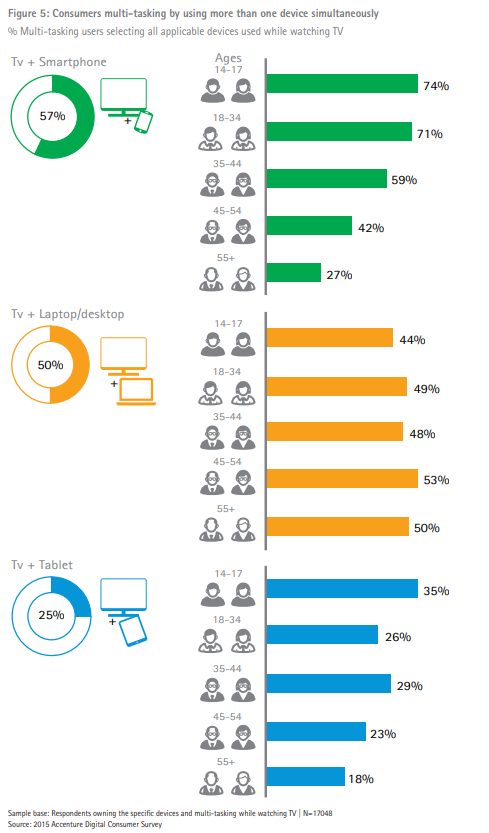
In fact, a report by Accenture found that 87% of audiences are just like me, browsing on one device while viewing content on another.
In the graph below, we see a more detailed breakdown of consumers who multi-task while watching TV. Note the data is separated into TV + smartphone, TV + laptop/desktop, and TV + tablet, and segmented by age.
This constant connectivity creates boundless possibilities for data.
For example, what happens if I get an ad for pizza before a video I watch on desktop, use my smartphone to search for that specific chain near me, and later click on a coupon I get served on social, finally completing my long journey to a large pepperoni?
When it comes to marketing attribution, data science is the attempt to make sense of all that wayward consumer path by using a growing arsenal of tools.
Alexandra Darmon, Head of Research at data-driven attribution company Fospha, says:
“Data science is a multi-disciplinary blend of data analysis, algorithm developments, and technology, designed to solve complex analytical data problems. It can allow powerful predictive and analytical capabilities such as multi-touch attribution (MTA) and marketing mix modelling (MMM). With masses of consumer data at the fingertips of all businesses, data science helps to turn the numbers into key, actionable insights.”
But one of the biggest challenges for data scientists and marketers alike is marrying data to create those insights, since so much of our data comes from disparate sources.
Content produced in collaboration with Fospha.
We call highly organized data “structured.”
This is the information that we get from sources such as clicks or even point of sale. So if a customer is targeted with an ad and clicks, it’s pretty simple to record that click and turn it into an insight.
Or if I use my loyalty card to buy the same item on the second of every month, that data is pretty easily interpreted to mean I need that item on that day with predictable regularity.
If only all data were so simple.
Unfortunately, most of the data customers are putting out there is unstructured. In fact, Forrester estimates that as much as 80% of data is unstructured, and that number is set to jump to 93% by 2020.
So what counts as unstructured data? Basically anything that isn’t stored in a database, so all that data from email, documents, audio, video, etc. But does the fact that it’s not structured mean it’s not usable?
Absolutely not, according to Darmon:
“By unifying statistics and data analysis, data science can extract knowledge from both structured and unstructured data, diving in at a granular level to understand complex behaviors and trends, and therefore inform future business decisions. The insights from this process can lead to more unified measurement of marketing performance as well as delivering accurate channel-mix predictions. However, marketers have been slow to adopt and properly apply these disciplines within their wider marketing strategies.”
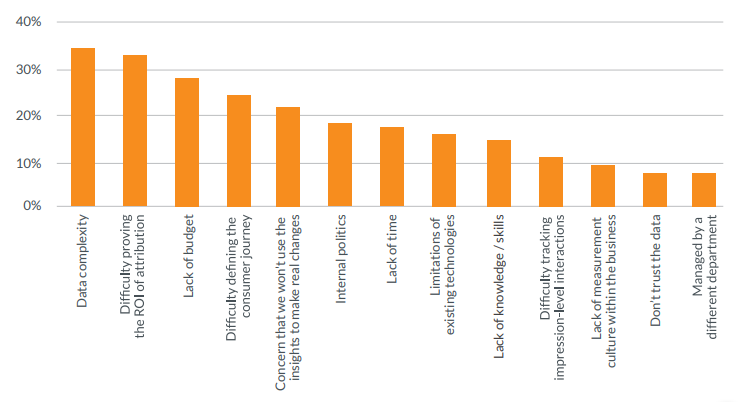
Most business are struggling to make sense of the constant stream of unstructured data flowing in. A survey conducted by Fospha and ClickZ found that 33% of advertisers struggle with data complexity.
What are the biggest obstacles to more effective use of marketing intelligence technology at your organization? (Select up to three.)
In order to solve this problem, many companies have adopted an almost untenable number of solutions in order to gain customer insights from all their data.
The survey found that, on average, brands are using about seven different solutions.
What’s the problem with that? It’s nearly impossible to marry all those insights into one actionable data plan. The study found that just one-third of survey respondents believe that their current measurement solutions perform accurate attribution of all marketing campaigns. Which means they’re really not sure how customers are getting from their first contact with a brand to their final purchase.
The solution isn’t adding tools to an already cluttered arsenal ad nauseam. It’s adding smart tools that marry insights in order to build a clear picture of the buyer journey. Last-click attribution tools, for example, only tell a tiny portion of the story.
Remember that customer (me) second-screening and deciding, after being targeted on both devices, to order pizza?
Adopting a single-platform, multi-touch attribution model would help marketing teams see all the data that led to that eventual purchase, giving a complete picture of the buyer’s journey from first touch to last.
For more information on how you can turn data into insights, check out ClickZ and Fospha’s white paper, “The State of Marketing Measurement, Attribution, and Data Management.”
Leave a Reply
You must be logged in to post a comment.