Four important ecommerce stats from Christmas 2016
Here we take a look at sales and abandonment data from the 2016 Christmas shopping season.
Here we take a look at sales and abandonment data from the 2016 Christmas shopping season.
Using data from SaleCycle clients, we look at sales and abandonment data from the 2016 Christmas shopping season.
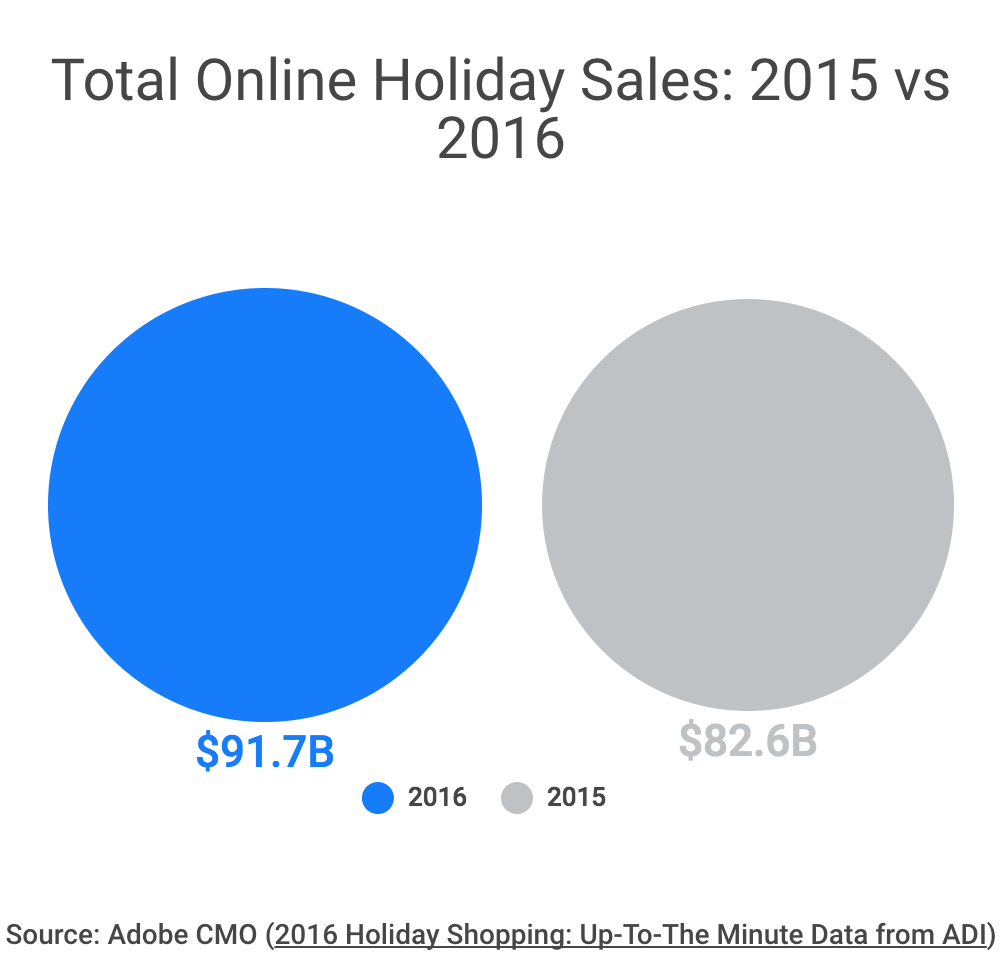
Adobe stats show that ecommerce continues to grow, with sales for 2016 up 11% on last year.
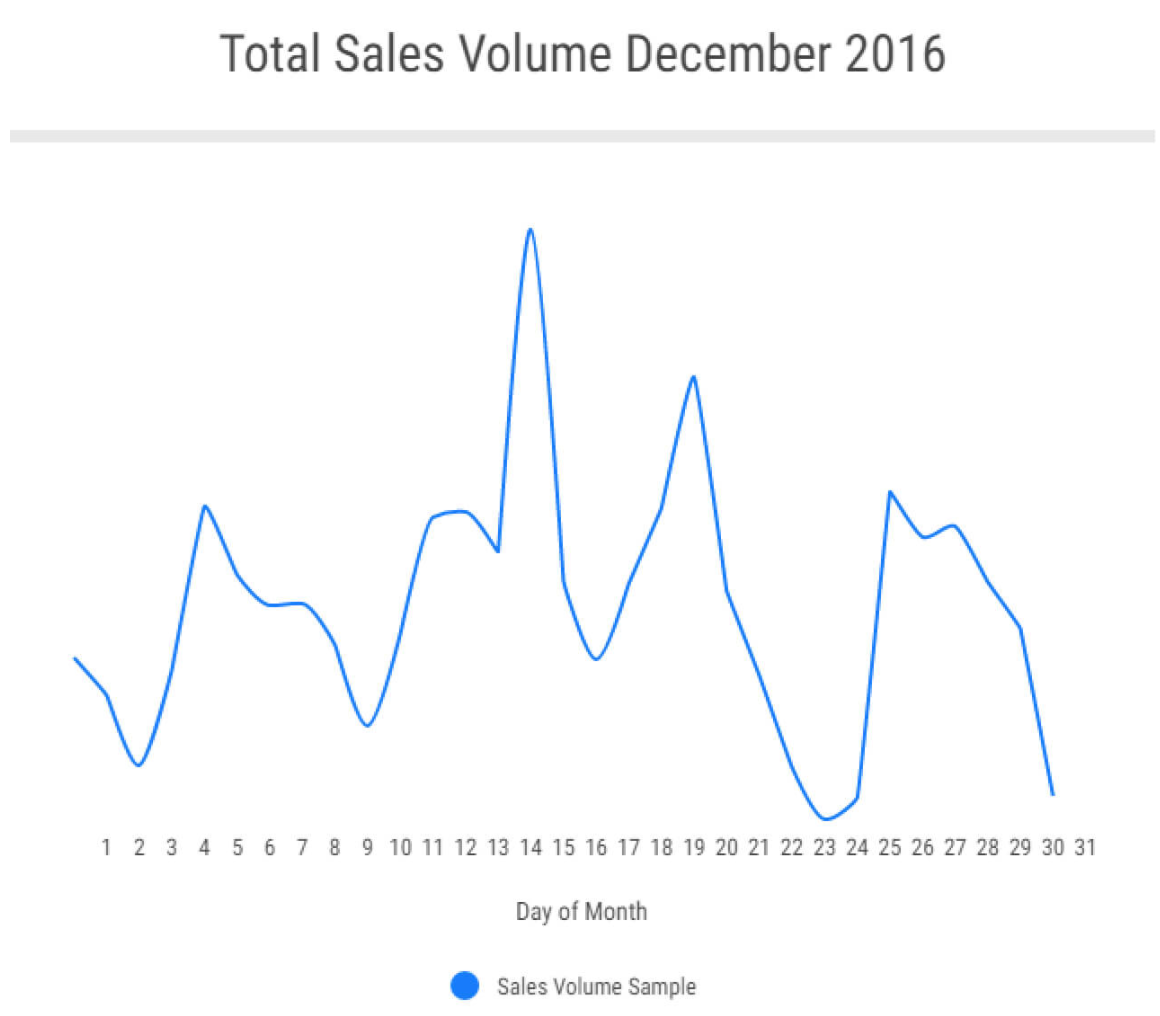
This chart, using a sample from our client data, looks at the biggest shopping days through December 2016 in terms of sales volume.
It should be noted that we saw higher sales volumes on Black Friday and Cyber Monday 2016 than for any day in December. Cyber Monday saw almost twice the sales volume of the busiest day in December, while Black Friday was almost three times as busy.
Our data shows sales volume peaking around 14th December, perhaps one of the last days for shopping online with a comfortable amount of time for gifts to be shipped before Christmas Day.
The second, smaller peak is around the 19th which is still just about enough time to ship for Christmas, but a little riskier. We can see sales volumes falling closer to Christmas Day as fewer retailers would be able to fulfil orders in time. Sales then build again from Christmas Day as people head online for bargains.
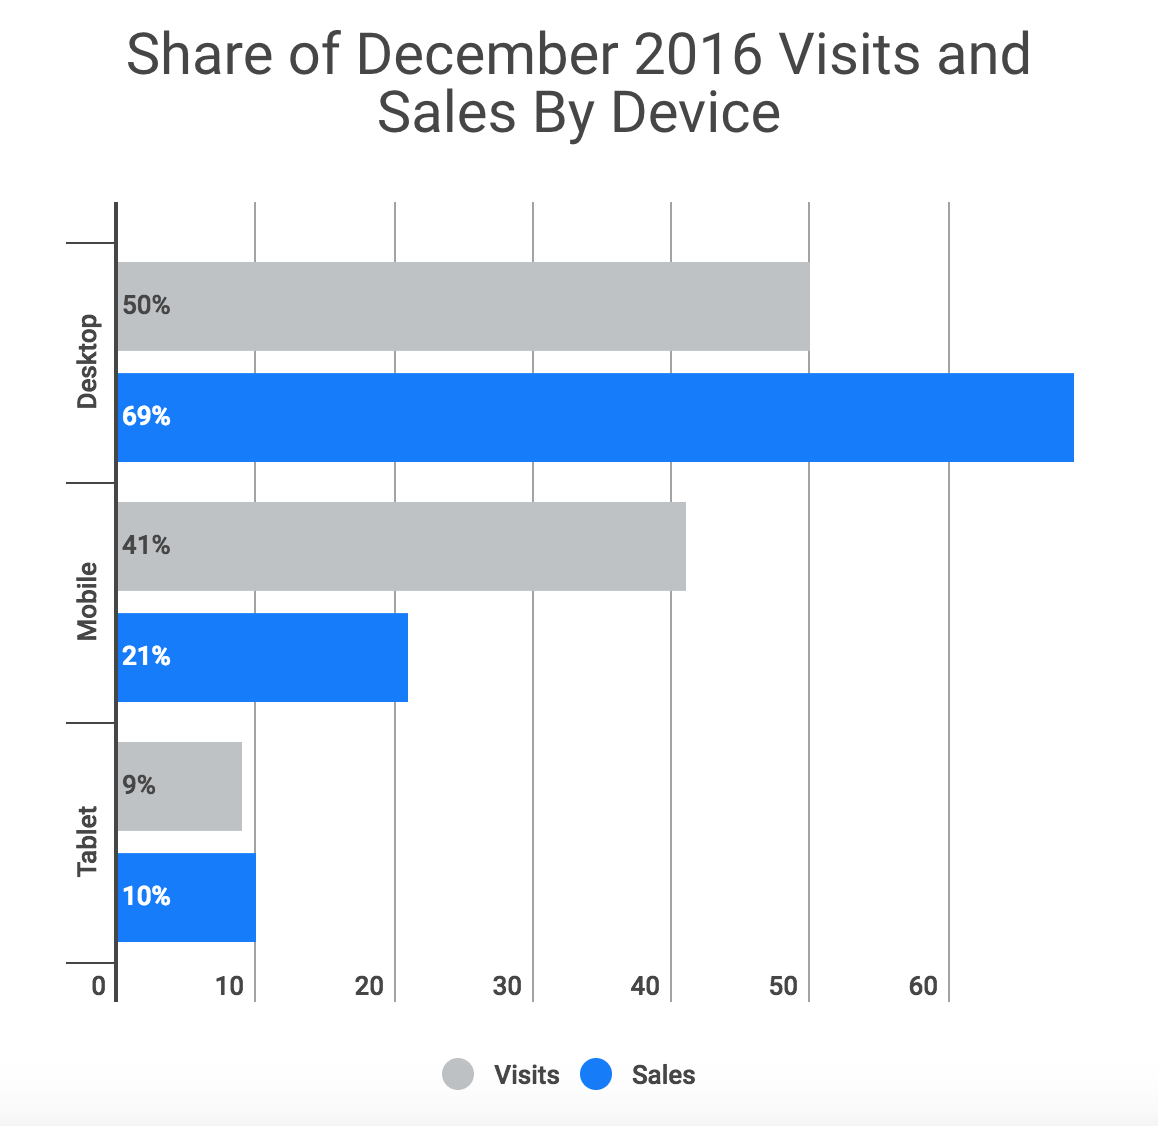
Adobe’s stats show some interesting splits between the different devices used for shopping in December.
Mobile traffic volume for retailers is very close to that of desktop (41% vs 50%). However, there is a much bigger difference in sales volume. 69% of sales came via desktop but just 21% from mobile (31% if you include tablet devices).
This suggests that, while people are using mobile more and more for shopping, it’s more about browsing and researching than buying for many, which a preference for completing transactions on desktop.
Mobile usability has improved a lot over the last few years, but it is still much easier to transact on a desktop site than mobile. Retailers need to look to improve checkout and to turn more mobile browsers into buyers.
Abandonment rates were at their lowest mid-December, around the same time as sales volume peaked (11h to 15th).
We also see abandonment rates rise slightly in the run up to Christmas. One explanation would be that customers added items to their shopping carts only to abandon after discovering they wouldn’t be shipped in time for Christmas.
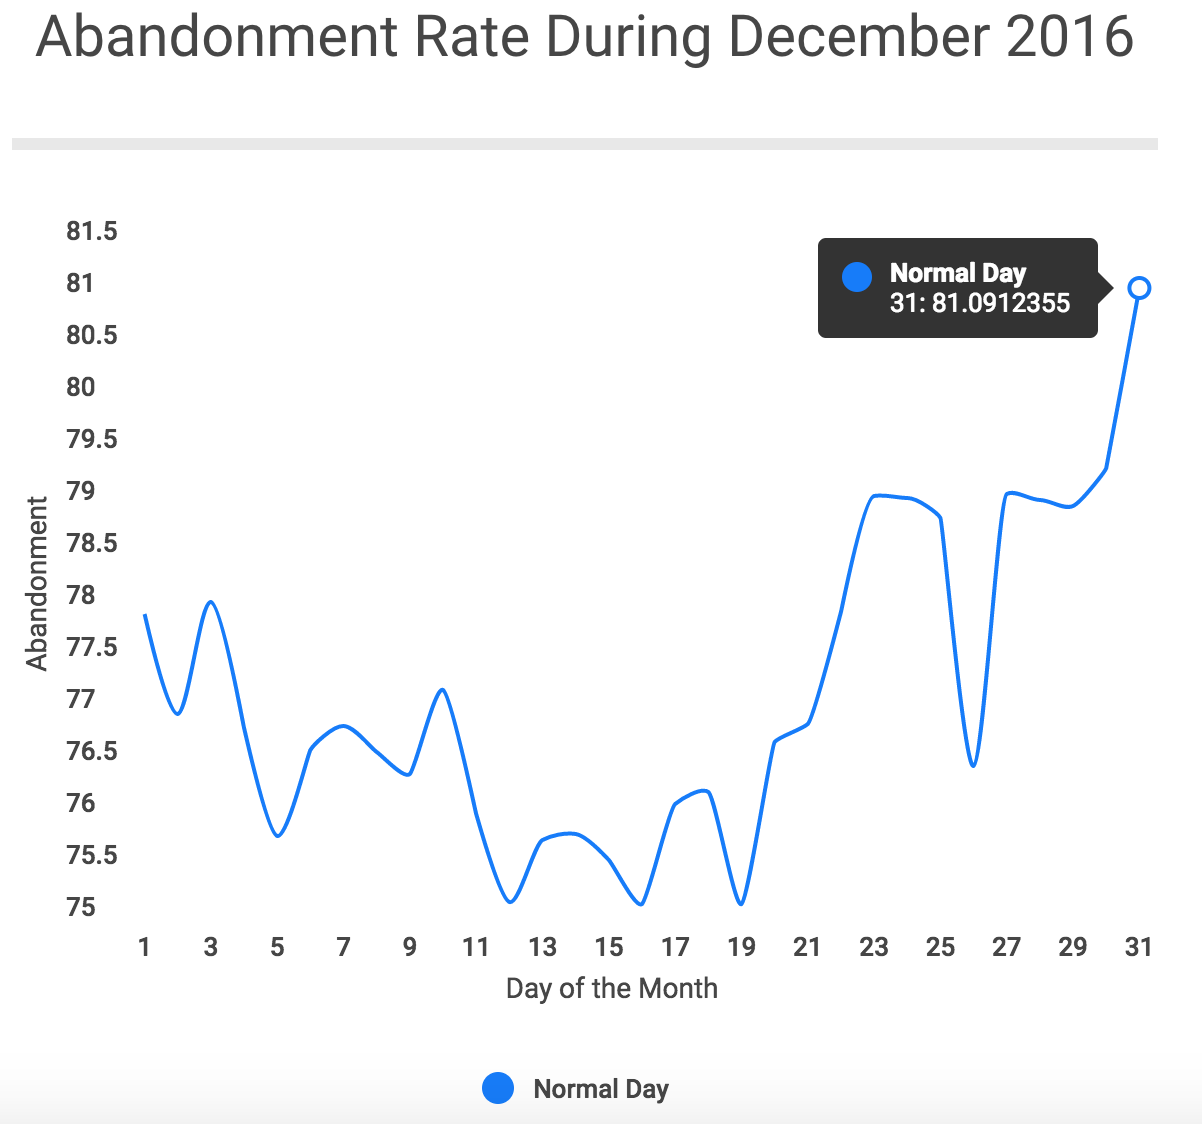
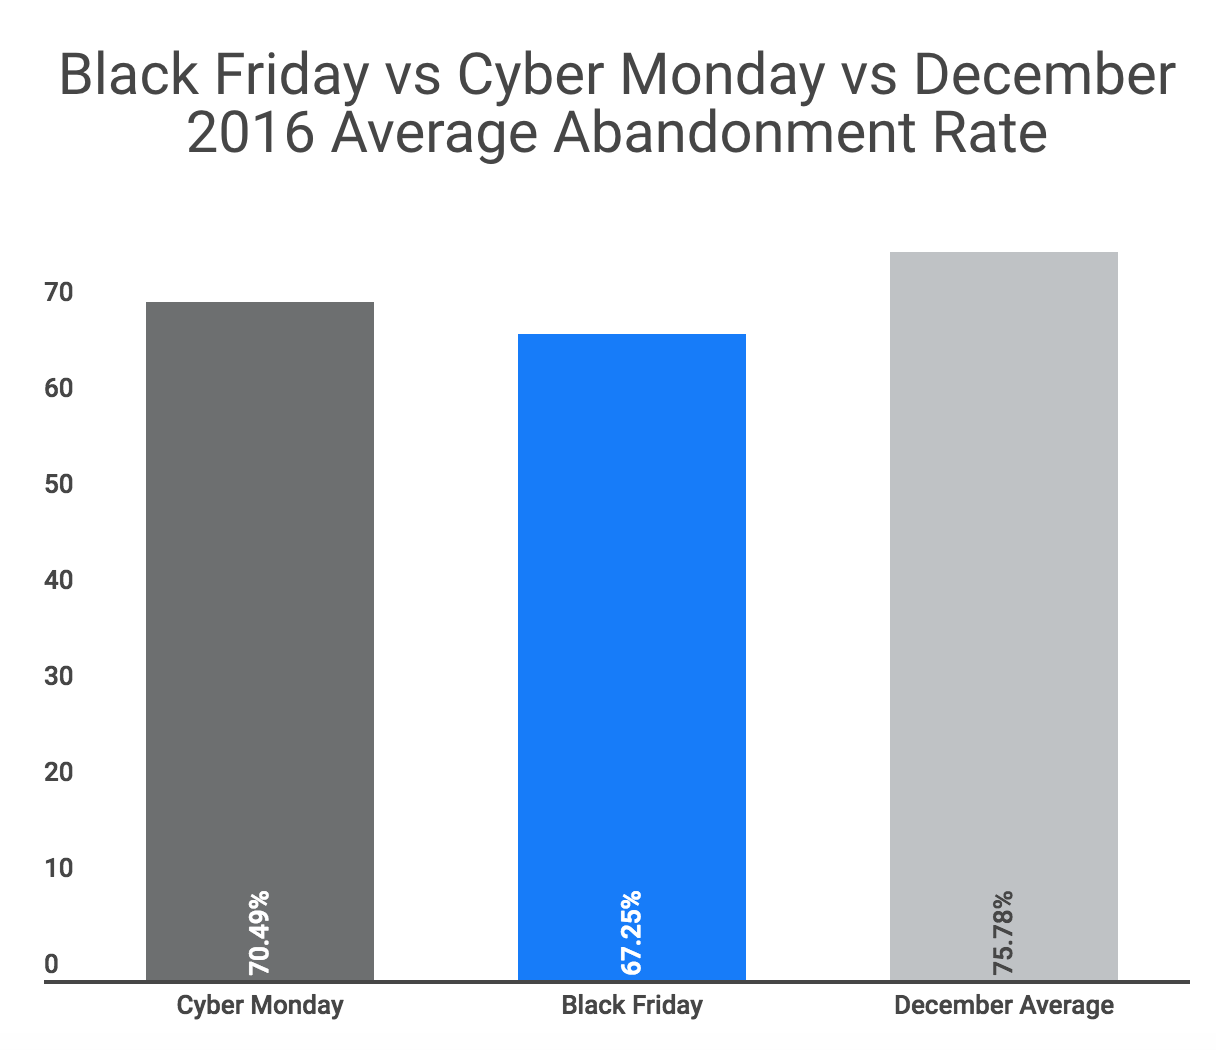
The average abandonment rate for December was 75.76%, higher than both Black Friday (67.25%) and Cyber Monday (70.49%).
This article was originally published on the SaleCycle blog: four key ecommerce trends. It is reprinted with permission.
Leave a Reply
You must be logged in to post a comment.