Facebook Insights is a highly useful tool for all Page managers looking for more information on their social performance and brand following.
In fact, Facebook has recently announced the introduction of new metrics for the Insights page with the aim of offering improved measurement. All Page owners should start noticing the addition of:
- Follows
- Previews
- Recommendations
As the number of metrics increases, which ones are the most important for every Page manager?
There are many metrics to analyse when managing a Facebook Page, but some of them can be the starting point for a wider understanding of your audience and the performance of your posts.
Here are the metrics you need to observe on a weekly basis, along with what you can learn from each one of them:
Net likes
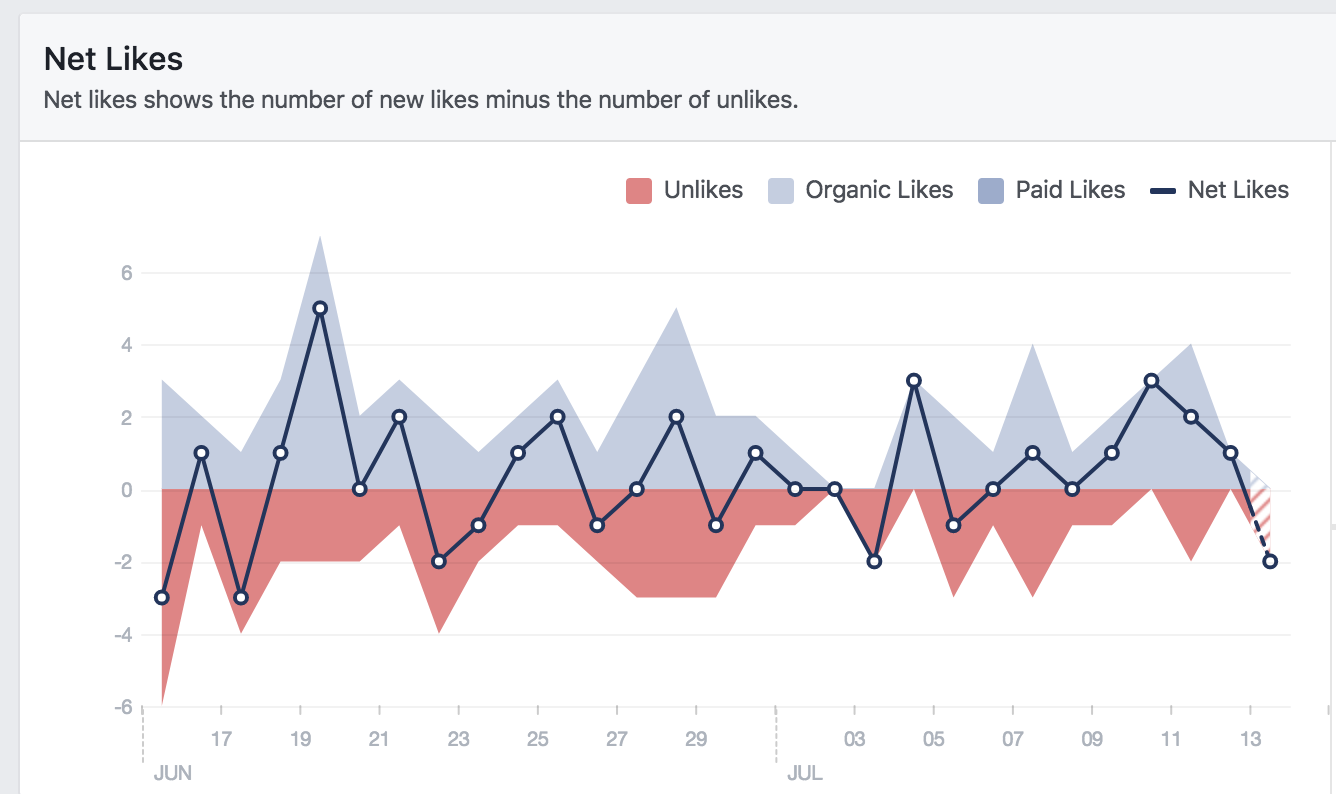
This isn’t just about tracking the number of likes your Page has – it’s equally important to measure the number of unlikes you’re having every week. How does the ratio of like/unlike go for your Page?
Was there a period when unlikes were higher than your usual numbers? This is an interesting graph to keep tabs on, especially to get a sense of how sentiment towards your Page has changed during a specific campaign.
It may be an indication that you need to evaluate how to win more likes while ensuring that your existing audience does not feel the need to unlike your Page.
Post reach

It may become more challenging to maintain the reach of your Facebook posts as Facebook shifts more emphasis towards paid advertising, but it’s still useful for tracking performance.
In fact, the combined analysis of your organic and paid reach can be more interesting, as it highlights the potential of your posts to reach a wider audience. By itself, a post’s reach isn’t necessarily an indication of your Page’s success unless you’re aiming only for brand awareness, but it’s still useful to analyse whether your posts had an abnormally high or low reach compared to your average.
Post engagement (Likes, comments, and shares)

Going beyond reach, it’s equally important to monitor the engagement that takes place on your Page as a gauge of how active a community you’ve managed to build.
What’s the average number of likes, comments, and shares that your content gets? Is there a stable trend, or were there any surprising peaks?
This graph can help you understand how your audience interacts with your posts and it may even help you decide on your marketing strategy. For example, if there is a lack of comments over the past month, but there has been an increase in reactions, it might mean that you can still maintain engagement by focusing on reactions, rather than comments.
Many Pages oft for the strategy of encouraging reactions, which are quicker and easier to leave than a text comment. Now that interaction on Facebook goes beyond Likes, they can also be a valuable litmus test of the emotional reaction to your posts and to your brand as a whole.
Top Sources

Do you know where your Page’s traffic comes from? It may seem obvious that most of the traffic comes from the Facebook homepage and users’ news feeds, but what if you promote your Page on your site? How about any other pages that might be mentioning your Facebook Page?
For example, if you’ve just started a campaign to promote your Facebook page, this section can help you analyse the resultant traffic and gauge the success of your campaign.
Total actions on page

Where do people click when visiting your Page? Are they interested in clicking on your CTA? Did you happen to change the CTA and need to compare the performance of the new with the old one?
This is an interesting section to learn more about the habits of your fans and explore how to benefit from them.
When your fans are online

This is one of the most interesting metrics for a Facebook Page manager. Working out the best days and times to post your content is usually a good starting point for developing a social strategy and beginning to build an engaged community around your brand.
A closer look at the times that your audience is more active can help you adjust your publishing schedule and improve the effectiveness of your page.
It’s good to approach this section without any assumptions about your audience, as the results may be surprising.
Your fans

An analysis of your audience can help you decide on the type of content you’ll be posting. For example, how does gender or age affect your posting strategy?
Can location affect the management of your page? Do you need to think locally if your audience is predominantly in one area?
People nearby

If you’re focusing on local marketing, then it’s certainly very useful to keep an eye in the Local section on Facebook Insights. This section offers a great analysis of your local audience, their behavior and how they react to your ads.
For example, if your business wants to promote a product in a specific region, then you can explore the best times to activate an ad and measure its performance through this section.
Overview
Facebook Insights has developed into a great tool for measuring the success of your Page. Even the most sophisticated Facebook strategy can benefit from a weekly analysis of the most important metrics.
A closer look at the metrics above can offer the right tips to improve a brand’s relationship with their target audience, increasing the effectiveness of every campaign.
Although the suggested metrics can be analysed in a quick 15-minute weekly measurement, you can always spend more time on your Page’s Insights to create a detailed understanding of your target audience.
As Facebook becomes more serious about its Insights for every Page, it’s time for all Page managers to monitor them accordingly.
Leave a Reply
You must be logged in to post a comment.