Marketer's guide to data-driven marketing attribution
James Kinley, Principal Data Scientist at Cloudera, showcases how marketers can build a custom, data-driven attribution model to measure the performance of their global campaigns.
James Kinley, Principal Data Scientist at Cloudera, showcases how marketers can build a custom, data-driven attribution model to measure the performance of their global campaigns.
Marketing attribution is a way of measuring the value of the campaigns and channels that are reaching your potential customers.
By using the results of an attribution model, you can understand what touchpoints have the most influence on successful buyer journeys and make more informed decisions on how to optimize investment in future marketing resources.
But we all know that buyer journeys are rarely straightforward, and the paths to success can be long and winding.
With so many touchpoints to consider, it’s difficult to distinguish between the true high and low impact interactions, which can result in an inaccurate division of credit and a false representation of marketing performance.
This is why choosing the best attribution model for your business is so important.
In this post, we’ll discuss a bit of background on different attribution models, and ultimately, how to build a custom, data-driven attribution model to measure the performance of global campaigns.
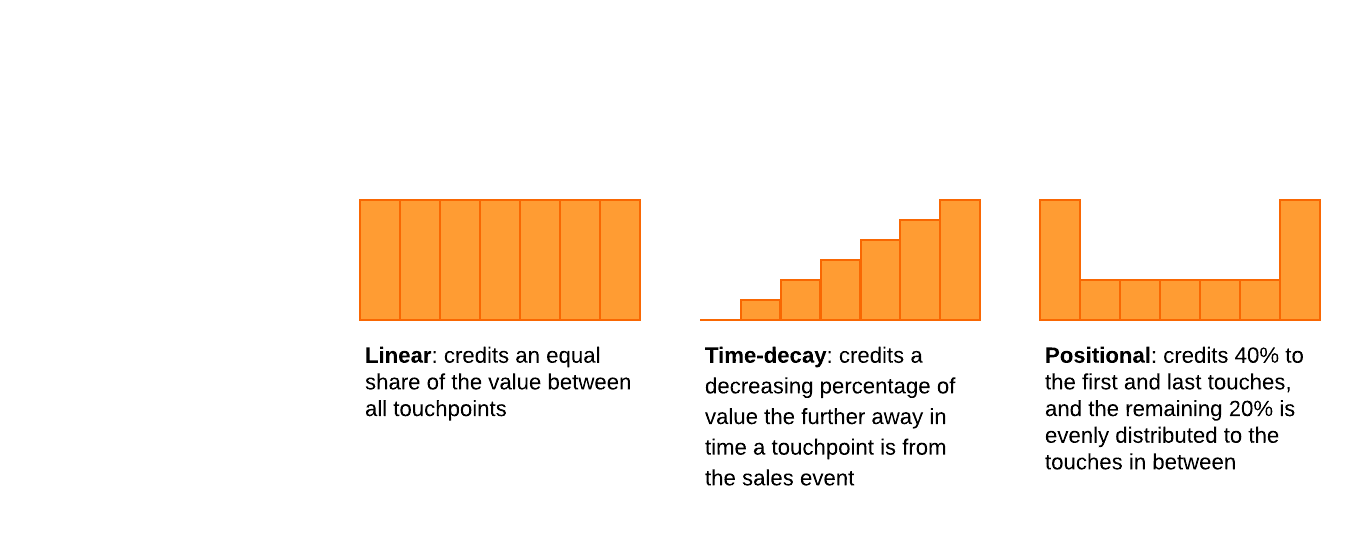
All attribution models have their pros and cons, but one drawback the traditional models have in common is that they are rules-based. The user has to decide upfront how they want the credit for sales events to be divided between the touchpoints.
Traditional models include:
Luckily, there are more sophisticated data-driven approaches that are able to capture the intricacies of buyer journeys by modelling how touchpoints actually interact with buyers, and each other, to influence a desired sales outcome.
We also evaluated the Shapley model from cooperative game theory. This popular (Nobel prize-winning) model provided much more insight into channel performance than the traditional approaches, but it didn’t scale to handle the sheer volume of touchpoints in today’s digital world.
The Shapley model performed well on a relatively small number of channels, but most companies need to perform attribution for all campaigns, which can equate to hundreds of touchpoints along a buyer’s journey.
Markov’s probabilistic model represents buyer journeys as a graph, with the graph’s nodes being the touchpoints or “states”, and the graph’s connecting edges being the observed transitions between those states.
For example, a buyer watches a product Webinar (first state) then browses to LinkedIn (transition) where they click on an Ad impression for the same product (second state).
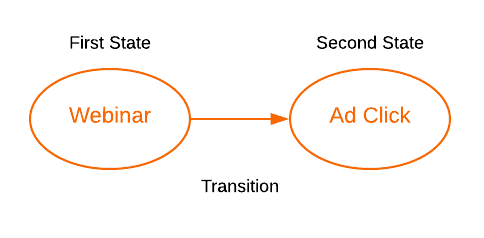
The key ingredient to the model is the transition probabilities (the likelihood of moving between states).
The number of times buyers have transitioned between two states is converted into a probability, and the complete graph can be used to measure the importance of each state and the most likely paths to success.
For example, in a sample of buyer journey data we observe that the Webinar touchpoint occurs 8 times, and buyers watched the webinar followed by clicking on the LinkedIn Ad only 3 times, so the transition probability between the two states is 3 / 8 = 0.375 (37.5%).
A probability is calculated for every transition to complete the graph.
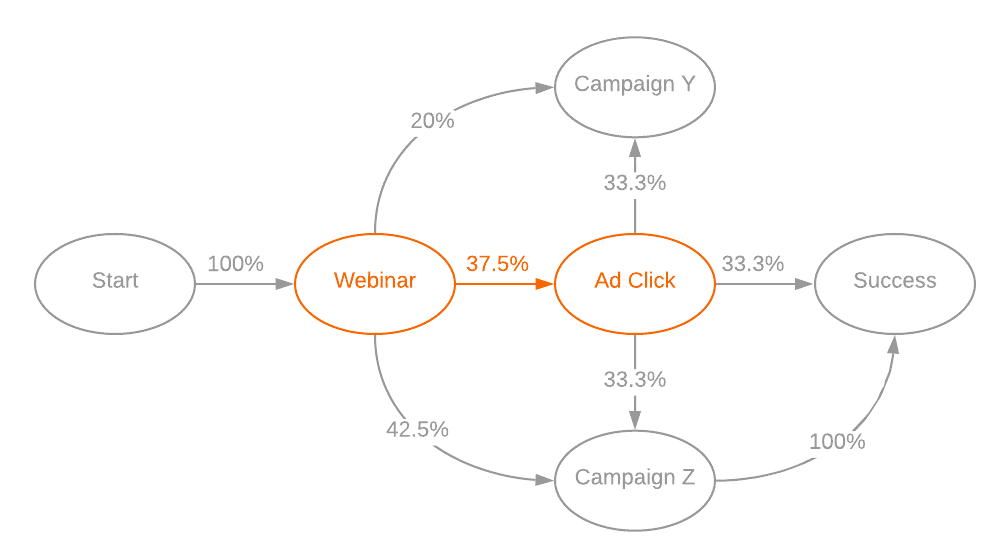
Before we get to calculating campaign attribution, the Markov graph can tell us a couple of useful nuggets of information about our buyer journeys.
From the example above you can see that the path with the highest probability of success is “Start > Webinar > Campaign Z > Success” with a total probability of 42.5% (1.0 * 0.425 * 1.0).
The Markov graph can also tell us the overall success rate; that is, the likelihood of a successful buyer journey given the history of all buyer journeys. The success rate is a baseline for overall marketing performance and the needle for measuring the effectiveness of any changes.
The example Markov graph above has a success rate of 67.5%:

A Markov graph can be used to measure the importance of each campaign by calculating what is known as the Removal Effect.
A campaign’s effectiveness is determined by removing it from the graph and simulating buyer journeys to measure the change in success rate without it in place.
Using Removal Effect for marketing attribution is the final piece of the puzzle. To calculate each campaign’s attribution value we can use the following formula:

For example, say that during the first quarter of the fiscal year the total USD value of all successful buyer journeys is $1M.
The same buyer journeys are used to build a Markov model and it calculated the Removal Effect for our Ad campaign to be 0.7 (i.e. The buyer journey success rate dropped by 70% when the Ad campaign was removed from the Markov graph).
We know the Removal Effect values for every campaign observed in the input data, and for this example let’s say they sum to 2.8. By plugging the numbers into the formula we calculate the attribution value for our Ad campaign to be $250k.
The marketing attribution application above was developed by Cloudera’s Marketing and Data Centre of Excellence, but you can get started today on your own model.
By leveraging a data-driven attribution model you can eliminate the biases associated with traditional attribution mechanisms, and understand how various messages influence potential customers and the variances by geography and revenue type.
Once you have solid and trusted data behind attribution, you can be confident in using the results to inform and drive marketing mix strategy and investment decisions. And, you can rely on the numbers when you partner with sales teams to drive marketing strategies forward.
James Kinley is a Principal Data Scientist at Cloudera. He joined them from the UK defense industry where he specialized in cyber security.
Leave a Reply
You must be logged in to post a comment.