Why you should be using data to fuel your content
Data. It’s the latest ‘buzzword’ in the digital marketing world when it comes to content.
Data. It’s the latest ‘buzzword’ in the digital marketing world when it comes to content.
Data. It’s the latest ‘buzzword’ in the digital marketing world when it comes to content.
News site Buzzfeed is the leader when it comes to data driven content and was also the first media company to really tap into the ‘what, when and why’ of sharing. They are also particularly qualified when it comes to click-bait style headlines – which I know you probably love.
But no matter how much these headlines may irk you, Buzzfeed knows we simply can’t help but click through to find out what Harry from One Direction’s hair looks like now or why a funny looking dog is stealing the hearts of everyone on the Internet.
Or maybe that’s just me. Dogs are great.
These click bait titles, mixed up with a few ‘normal’ headlines, allow Buzzfeed to work out exactly what is drawing readers in, and after attending a Guardian masterclass with their Head of European Growth Luke Lewis last year (I’ve talked about this in more detail in another blog post, click here to have a read) I discovered that if it’s heartfelt or could encourage an angry reaction, it’s going to hook people in.
This type of data is informing those who create content. It’s directing us towards our demographics, notifying us how well a certain post has done, who is reading it and allowing us to understand how to create bigger and better content through trial and error – informed by cold hard facts.
It’s also allowing us to create bigger and better content, using stats to back up what we say and allowing us to put our client’s forward as thought leaders in their industry.
So how can you also use data to drive your content forward, to ensure it reaches the right eyes and is shared how you intended on relevant social media platforms? Here are some ideas:
Social media
Your first port of call is your client’s social media platforms. Whether their business loves to tweet, put together snappy posts for Facebook or take hashtag worthy pictures for Instagram, you’ll be able to work out who the content should be targeting from those already following them. These are the people already interested in what the brand does, so everything you create should be targeted at them and then shared on these platforms to reach their eyes first.
There’s a certain element of exclusivity when it comes to social media, if you are following a brand you expect them to tell you first about a new launch or update because you have very generously chosen to follow them.
Social media is also great for feedback. People are very quick – sometimes a little too quick perhaps – to let you know what they like or don’t like, when it comes to your latest piece of content or advertising.
Don’t be disheartened, though, if Jeff from Derby writes an epic rant in the comments section on Facebook, tagging all his friends and telling you that you’re wrong, this is great data – plus if other people are confirming Jeff’s point it’s a good lesson for future content. Of course, it’s best to avoid this type of reaction but it happens to the best of brands – just take a look at these content blunders. The general public are an unpredictable force.
Work on improving engagement
Working out how many people have actually engaged with your content is also a good place to start when it comes to data. Coming back to that Guardian Masterclass I mentioned earlier, and Buzzfeed’s click-bait titles, Lewis also told us how important headlines are when it comes to driving audience to a post. He informed us that his team will come up with four or five alternative titles and then alternate these a few hours after the post goes live.
They then check through the engagement data to determine which headlines elicited the strongest amount of click-throughs. Of course, we’re not all national publishers with the luxury of being able to switch titles around, as well as trying to create engaging content based on a news story related to our industry that day, but it demonstrates an interesting way of analysing data and making content work for you.
However, if you are considering the concept of implementing a ‘brand as publisher’ approach in the future then be sure to check out this post by Zazzle Media’s MD, Simon Penson, around the premise.
The data behind scheduling content
The time of day you put out content makes a difference and there is plenty of data out there to back this up. It’s important you first pay close attention to your client’s engagement stats, as this will determine when your content was interacted with most – and whether this simply applies to page views or comments and shares.
Twitter has a clever inbuilt feature you can use and have probably already played around with when it comes to determining when best to share content on the platform. Each tweet you put out has a breakdown of how it has been engaged with, and you can determine what times are best to put out your content.
If you can piggyback on news for that day, then that’s also a great way of getting content shared. Tweets featuring images are also more likely to be engaged with (the gif function on Twitter now is well worth using) and the guys at Hubspot have noted that visual content is ‘40x more likely to get shared on social media than other types of content.’
Watch the stats, obtain the data and try to share content in a way that appears to engage your demographic.
Data in your content
Okay, now we’re onto the juicy bit. It’s not just about analytics and demographics – although you should be nailing that first. Data driven content is all about using important, exclusive stats within the content itself to give it accountability and to also offer something new.
If you are putting out content featuring exciting new statistics that you’ve collected say via a survey or a quiz, it’s going to get noticed. Putting in the leg work when it comes to data will pay off and here are a few ways to help you use it to your advantage…
Consider the different types of data
There are lots and lots of different types of data to include within your content, to give it some drive and integrity. Here are a few examples of the different types that can really help your posts fly…
‘Worthy’ data:
Easy ways to obtain such data could be via:
Understand that content needs authority to do well
And this authority needs to be provided by a reputable source. I write at Zazzle Media and we always work to create content that is engaging, informative and offers those reading it a new perspective on the subject. This is why we consider surveys and data cards to be our best friends, when creating infographics and interactive pieces, to pitch to leading websites.
For your blog posts or guest articles to do well, they need to be supported by data that has been curated from testing and can be supported by an expert.
Stats, updated figures and data that creates conversation is what you should be aiming for. If you’re writing a feature, which you intend to pitch to a leading news site because you’re focusing on the thought leadership side of things that month, then ensure you have reputable figures offering up quotes on whatever you’re talking about.
We’re not talking bloggers or self published individuals here though, they need to be scientists, politicians, charity spokespeople, CEOs. Credible sources ensure your content is taken seriously.
How is data collected?
Data is obtained, in most cases, via a question and answer tactic, usually through a survey or even a quiz, hosted on a brand’s site.
We recently created an interactive quiz for one of our clients, which aimed to test how much road rage bikers experienced when out riding. It uncovered some interesting data, which we could then use in our supporting content.
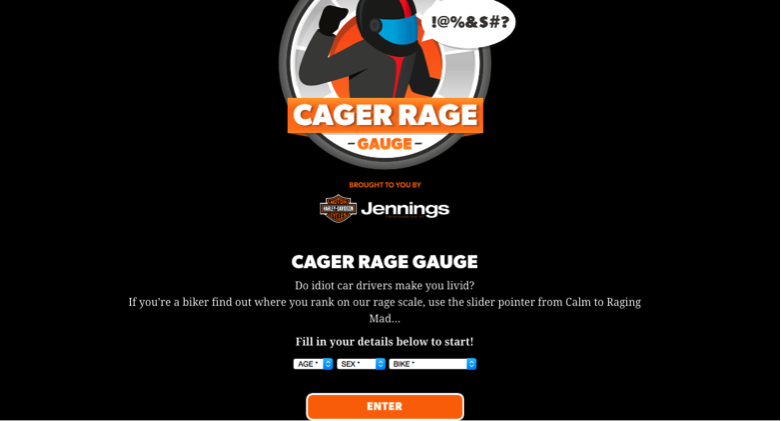
We obtained this data by asking a few key questions that could then be scraped from the results we received from the quiz, to create interesting statistics. We asked for the player’s age, sex and their favourite bike brand and from this uncovered the following data:
This is all interesting data that can be spun into something bigger, perhaps an in depth feature piece on female bikers, interviewing real women and asking them about their experiences on the road. Or even a data lead feature about bike safety, the results themselves and what they mean about road users.
The results give us something exclusive to play with that the sites who are interested in featuring our content will consider worthy of sharing. From this data we have created features, guest posts and blog content that has been shared in a variety of places to increase exposure of the quiz itself and encourage links back to the client.
Leave a Reply
You must be logged in to post a comment.